
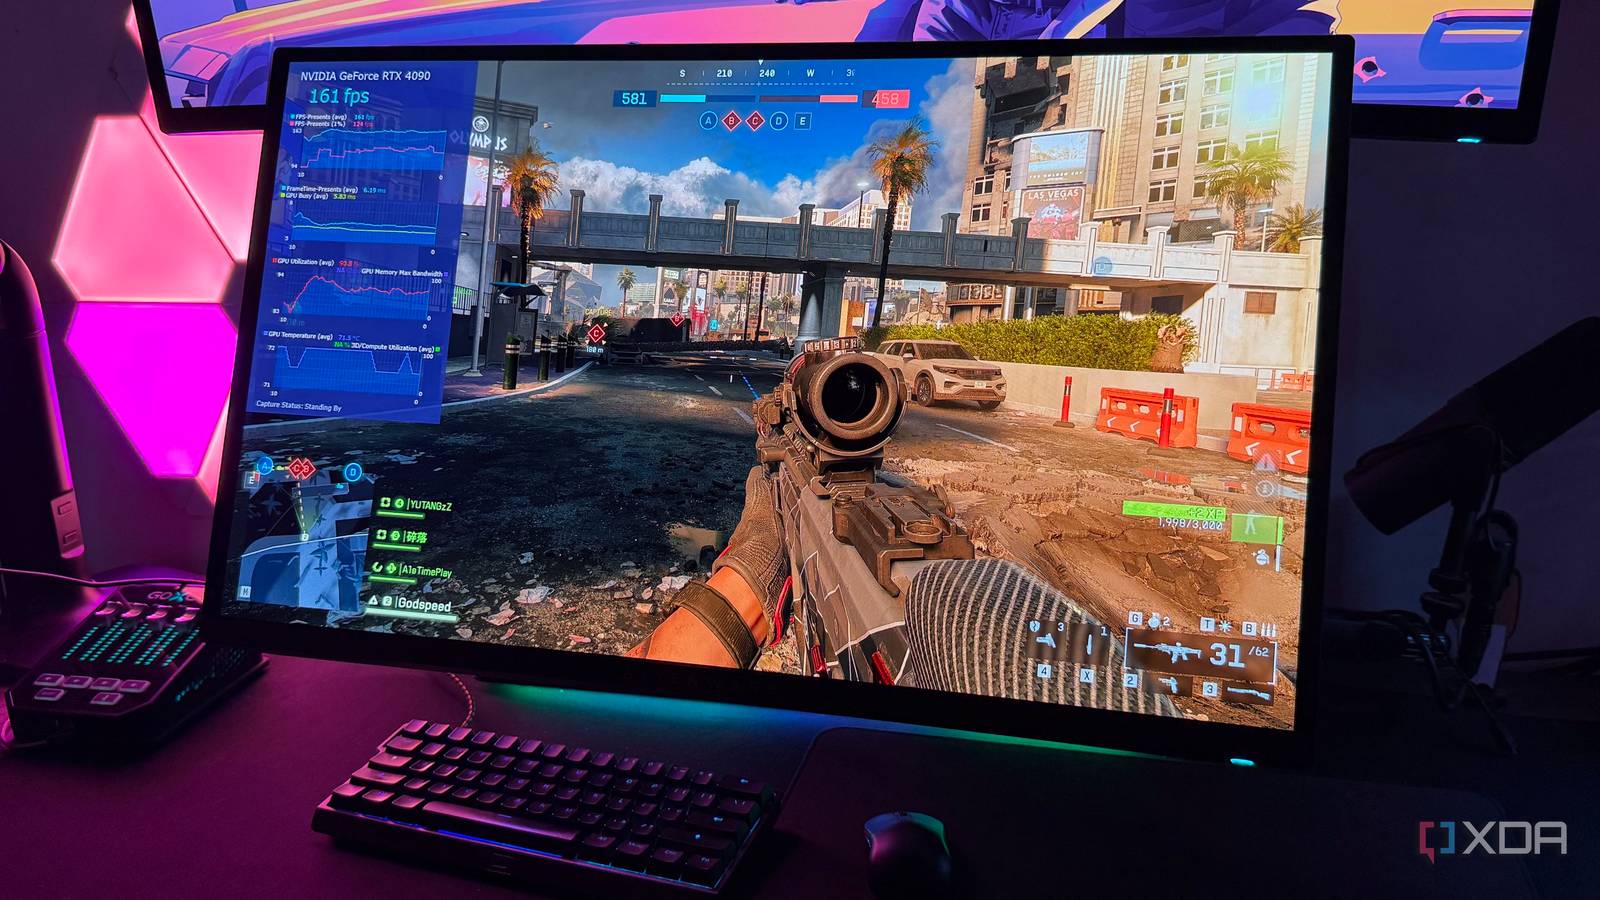
Published Nov 4, 2026, 12:01 PM EST Hamlin has been in the tech field for over nine years. Since 2017, his work has appeared on MakeUseOf, Android Police, OSXDaily, Beebom, and more. He served as the Senior Editor at Valnet's MakeUseOf for over two years before joining XDA. He uses a high-end gaming rig for desktop use and a MacBook for traveling, but dislikes some of the quirks of macOS. You're more likely to catch him at the gym or on a flight than anywhere else. For as long as I can remember, GPU usage has been the one metric I've relied on to know whether my CPU is bottlenecking my GPU. I don't expect it to be pinned at 99%, but when the GPU is consistently sitting at 70–80% utilization, there's a good chance it's waiting on the CPU to catch up. Of course, other factors like FPS caps, V-Sync, and game engine limitations can also reduce GPU usage, but once you've ruled those out, the CPU becomes the likely culprit. That said, you're still making assumptions with GPU usage alone because it doesn't tell you how much time your graphics card actually spends working on each frame. And that's where GPU Busy comes in, a metric that Intel PresentMon brought into the spotlight. It tells you how many milliseconds your GPU actively spends working on a frame, so when you compare it with your frame time, you can get a much better idea of whether your CPU or GPU is the bottleneck. GPU usage helps, but it isn't enough Because it isn't a per-frame measurement like GPU Busy There's nothing inherently wrong with monitoring GPU usage to identify CPU bottlenecks. If it stays close to 99% while you're gaming, that's usually a good indication that you're GPU-bound. The problem is that GPU usage isn't measured frame by frame. The percentage you see in MSI Afterburner or any other monitoring tool you use represents how busy your GPU was during a sampling interval. So, brief periods where your GPU is waiting on your CPU can get lost in the average. Also, just because your GPU usage is hovering around 80% doesn't automatically mean your CPU is bottlenecking it. Enabling V-Sync, adding an FPS cap, or running into game engine limitations and RAM bottlenecks can also lower its utilization. That's why you're better off monitoring the GPU Busy metric using Intel PresentMon. You get a real-time measurement of how long your GPU is working on a frame, which you can compare to your frame time to see how much of that interval is spent on actual GPU processing. You need to look at more than just GPU Busy, though But PresentMon makes that easy by plotting it alongside frame time GPU Busy is measured in milliseconds, but looking at that number alone isn't going to be helpful. You need to compare it with your frame time to better understand what's actually going on, and thankfully, Intel PresentMon lets you monitor both on the same graph. Let's say you're averaging 150FPS in a game, which works out to 6.67ms per frame. If your GPU Busy hovers around 6ms, it means your graphics card is spending almost the entire frame interval processing work, so you're probably GPU-bound. Now, what if GPU Busy is lower at around 4ms? That's a 2.67ms gap between GPU Busy and frame time, suggesting your GPU finishes its work before the next frame is delivered. If you're seeing a similar gap across multiple frames, that could very well be a sign of a CPU bottleneck, but don't assume your CPU is spending that remaining 2.67ms preparing the next frame because CPU and GPU workloads can overlap. To narrow things down, you can lower your resolution or dial back some GPU-intensive settings. If GPU Busy drops further but your frame rates barely improve, you've probably hit your CPU's limits. GPU Busy isn't the be-all and end-all either But it still tells you more than GPU usage alone Of course, just because GPU Busy is a lot lower than your frame time doesn't immediately mean your CPU is the bottleneck. As I mentioned earlier, FPS caps and V-Sync can prevent your GPU from working harder even if your CPU has no trouble keeping up. And let's not forget how slower RAM could also make your CPU wait for data, increasing frame times. Then, there's the fact that some games are simply CPU-bound because of engine limitations. For instance, Valorant doesn't fully utilize my RTX 4090 even though I have it paired with the 9800X3D. But these are reasons to interpret the numbers properly, not dismiss the metric altogether. GPU Busy, just like GPU usage, cannot pinpoint a CPU bottleneck, but it does help you narrow things down. And in many cases, you're not going to be CPU-bound all the time. Some frames might take longer because of CPU-side stalls, while others could still be limited by your GPU instead. That's where GPU Busy has the edge over a utilization percentage. I still rely on both metrics, though, because I have MSI Afterburner running most of the time, and GPU usage quickly tells me something's off. Start with GPU usage, but don't stop there If you suspect a CPU bottleneck, the first metric I'd still recommend checking would be GPU usage because it's straightforward and something we're all accustomed to. Then, you can lower the graphics settings or enable DLSS to see if reducing your GPU's workload actually improves your FPS. If it barely moves, that's when I'd launch PresentMon and start monitoring GPU Busy. Just make sure you don't forget the other factors before you start blaming your CPU. At the end of the day, no single metric can pinpoint the actual problem. It's all about narrowing down the possibilities with the information you have. Intel PresentMon PresentMon is an open-source monitoring tool developed by Intel that helps you identify CPU and GPU bottlenecks by comparing GPU Busy with frame times.
This overlooked metric can reveal CPU bottlenecks that GPU usage alone can't
Full Article
Original Source
Read the full article at Xda-developers →KhanList aggregates and links to publicly available news content. We do not host full articles from third-party sources. Always verify important information with original sources.