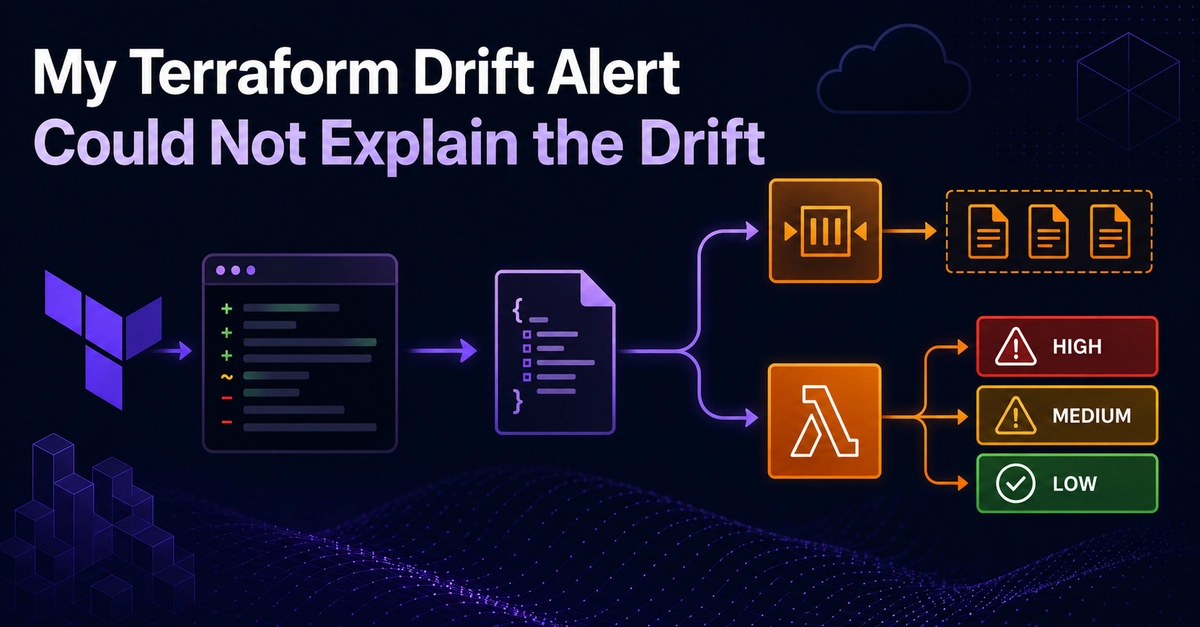
My Terraform drift detector had a problem. It could run terraform plan, detect drift, and send me an email through SNS. But the message only told me that drift existed. It did not tell me which resources changed. It did not tell me whether the change affected IAM, networking, or something less critical. So I changed the alert into a structured event and sent it to two places: SQS for audit processing and Lambda for severity classification. The Stack CodeBuild → runs terraform plan ↓ terraform show -json → extracts the changed resources ↓ SNS → publishes one structured event ↓ ├── SQS → keeps the event for audit processing └── Lambda → classifies changes as HIGH, MEDIUM, or LOW ↓ CloudWatch → stores the classification logs Enter fullscreen mode Exit fullscreen mode Step 1: Publish Structured Drift Details The build already saved the Terraform plan: terraform plan -detailed-exitcode -out=plan.tfplan -lock=false || EXIT_CODE=$? Enter fullscreen mode Exit fullscreen mode Exit code 2 means Terraform found changes. When that happens, I convert the saved plan to JSON: terraform show -json plan.tfplan > /tmp/plan.json Enter fullscreen mode Exit fullscreen mode Terraform plan JSON is large. SNS and Lambda do not need all of it, so I used jq to keep only the useful fields: DRIFT_CHANGES=$(jq -c '[ .resource_changes[] | select(.change.actions != ["no-op"]) | { address: .address, type: .type, actions: .change.actions } ]' /tmp/plan.json) Enter fullscreen mode Exit fullscreen mode Each change now contains: { "address": "module.compute.aws_iam_role.ec2_role", "type": "aws_iam_role", "actions": ["create"] } Enter fullscreen mode Exit fullscreen mode The important part here is what I left out. I did not publish the complete before-and-after resource values. Resource address, type, and action are enough for classification without sending the entire Terraform plan through SNS. Step 2: Send the Event to SQS I created an SQS queue called terraform-drift-audit and subscribed it to the SNS topic. resource "aws_sqs_queue" "drift_audit" { name = "terraform-drift-audit" } resource "aws_sns_topic_subscription" "sqs" { topic_arn = aws_sns_topic.drift.arn protocol = "sqs" endpoint = aws_sqs_queue.drift_audit.arn } Enter fullscreen mode Exit fullscreen mode I also added the queue URL as a Terraform output: output "sqs_queue_url" { description = "URL of the drift audit SQS queue" value = aws_sqs_queue.drift_audit.url } Enter fullscreen mode Exit fullscreen mode After terraform apply, I can retrieve the URL without opening the AWS console: terraform output -raw sqs_queue_url Enter fullscreen mode Exit fullscreen mode That URL is what I used with the AWS CLI to check whether SNS delivered the message. SQS also needs permission to receive messages from SNS. I restricted the queue policy to the drift topic instead of allowing every SNS topic: Condition = { ArnEquals = { "aws:SourceArn" = aws_sns_topic.drift.arn } } Enter fullscreen mode Exit fullscreen mode SQS is not the final audit database. It keeps the event available for a future consumer. Permanent drift history belongs to a later phase. The Queue Existed in the Wrong Region I copied the queue URL into this command: aws sqs receive-message \ --queue-url https://sqs.us-east-2.amazonaws.com//terraform-drift-audit \ --max-number-of-messages 10 Enter fullscreen mode Exit fullscreen mode AWS returned NonExistentQueue. The queue existed. My AWS CLI was using us-east-1, while the Terraform project created the queue in us-east-2. The fix was adding the region explicitly to the same command: aws sqs receive-message \ --queue-url https://sqs.us-east-2.amazonaws.com//terraform-drift-audit \ --max-number-of-messages 10 \ --region us-east-2 Enter fullscreen mode Exit fullscreen mode The resource name was correct. The CLI was asking the wrong regional endpoint. After fixing the region, I could see the structured drift message in SQS. Step 3: Classify Every Change with Lambda The Lambda function receives the same SNS event that went to SQS. SNS does not send my drift JSON as the top-level Lambda event. It wraps the message inside Records[].Sns.Message. The function must first extract that string and parse it back into JSON. This is the complete classifier: import json import os from datetime import datetime, timezone # Severity definitions HIGH_RISK_TYPES = { "aws_security_group", "aws_security_group_rule", "aws_iam_role", "aws_iam_policy", "aws_iam_role_policy", "aws_iam_user", "aws_iam_group", "aws_iam_access_key", } MEDIUM_RISK_TYPES = { "aws_instance", "aws_db_instance", "aws_ecs_cluster", "aws_ecs_service", "aws_ecs_task_definition", "aws_lb", "aws_lb_listener", "aws_lb_target_group", "aws_nat_gateway", "aws_route_table", "aws_network_acl", } def classify_change(resource_type, actions): """Classify a single resource change by severity.""" if resource_type in HIGH_RISK_TYPES: return "HIGH" elif resource_type in MEDIUM_RISK_TYPES: # Delete or replace is more concerning than create if "delete" in actions or "replace" in actions: return "HIGH" return "MEDIUM" else: return "LOW" def lambda_handler(event, context): """Process SNS message with drift details and classify severity.""" print(f"Received event: {json.dumps(event)}") for record in event.get("Records", []): # SNS message is in the SNS record sns_message = record.get("Sns", {}).get("Message", "{}") try: drift_data = json.loads(sns_message) except json.JSONDecodeError: print(f"Failed to parse SNS message: {sns_message}") continue timestamp = drift_data.get( "timestamp", datetime.now(timezone.utc).isoformat() ) project = drift_data.get("project", "unknown") changes = drift_data.get("changes", []) # Classify each change classified = {"HIGH": [], "MEDIUM": [], "LOW": []} for change in changes: address = change.get("address", "unknown") resource_type = change.get("type", "unknown") actions = change.get("actions", []) severity = classify_change(resource_type, actions) classified[severity].append({ "address": address, "type": resource_type, "actions": actions, }) # Build summary summary = { "timestamp": timestamp, "project": project, "total_changes": len(changes), "high_count": len(classified["HIGH"]), "medium_count": len(classified["MEDIUM"]), "low_count": len(classified["LOW"]), "classified": classified, } # Log the classified drift print( f"Drift classification: {json.dumps(summary, indent=2)}" ) # TODO Phase 3: Auto-remediate HIGH severity changes # TODO Phase 3: Alert on MEDIUM severity changes return {"statusCode": 200, "body": "Drift classified"} Enter fullscreen mode Exit fullscreen mode The code does four things: Extracts the SNS message from the Lambda event. Parses the structured drift JSON. Classifies each resource by type and action. Writes the complete summary to CloudWatch Logs. IAM and security group resources are HIGH. Resources such as EC2, RDS, ECS, load balancers, NAT gateways, and route tables start as MEDIUM. Everything else starts as LOW. A delete or replacement on a MEDIUM resource becomes HIGH. This classifier is deliberately simple. It is a deterministic first version that I can read, test, and improve later. The Lambda Package Needed Another Provider Terraform packages the Python file using archive_file: data "archive_file" "severity_lambda" { type = "zip" source_file = "${path.module}/lambda/severity_classifier.py" output_path = "${path.module}/lambda/severity_classifier.zip" } Enter fullscreen mode Exit fullscreen mode The first run failed because the archive provider was missing from .terraform.lock.hcl. The fix was: terraform init -upgrade Enter fullscreen mode Exit fullscreen mode That downloaded hashicorp/archive and updated the lock file. The generated ZIP does not need to be committed. Terraform creates it when the configuration runs. Verification I triggered a real drift event and checked both destinations from the terminal. First I read up to 10 messages from SQS: aws sqs receive-message \ --queue-url https://sqs.us-east-2.amazonaws.com//terraform-drift-audit \ --max-number-of-messages 10 \ --region us-east-2 Enter fullscreen mode Exit fullscreen mode The structured message appeared in the SQS queue. Lambda received the event and wrote this summary to CloudWatch: aws logs tail /aws/lambda/terraform-drift-severity \ --follow \ --region us-east-2 Enter fullscreen mode Exit fullscreen mode --follow keeps the terminal attached to the log group. When the next drift event invokes Lambda, the classification appears directly in the terminal. { "high_count": 8, "medium_count": 13, "low_count": 38 } Enter fullscreen mode Exit fullscreen mode The HIGH results included an IAM role and an ALB security group: module.compute.aws_iam_role.ec2_role module.security.aws_security_group.alb_sg Enter fullscreen mode Exit fullscreen mode Lambda classified all 59 resource changes reported by that Terraform plan. This confirmed that the structured SNS event reached Lambda and that each change was assigned a severity. What Is Next The system can now tell me what changed and how serious each change might be. It still does not remediate anything. That is intentional. The next step is deciding what should happen after classification. I will start with LOW-severity updates that are safe to test automatically. MEDIUM, HIGH, and deletion paths will remain outside automatic remediation and will later require human review. That is Phase 3.
My Terraform Drift Alert Could Not Explain the Drift
Full Article
Original Source
Read the full article at Dev →KhanList aggregates and links to publicly available news content. We do not host full articles from third-party sources. Always verify important information with original sources.