
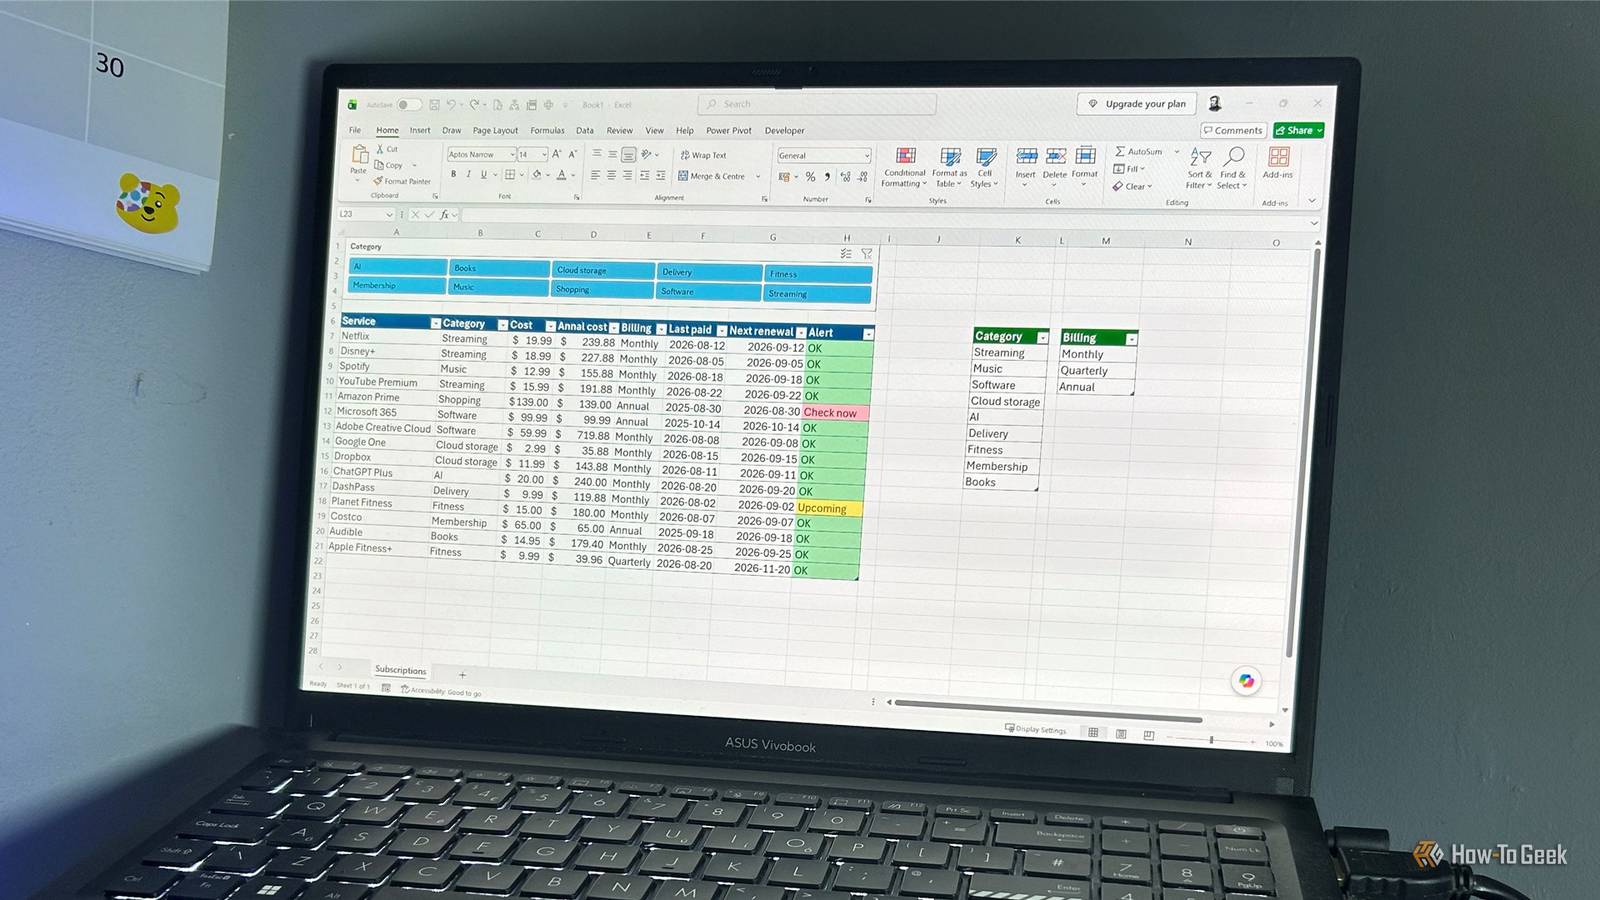
Published Sep 2, 2026, 7:00 AM EDT Tony Phillips is an experienced Microsoft Office user with a dual-honors degree in Linguistics and Hispanic Studies. Prior to starting with How-to Geek in January 2024, he worked as a document producer, data manager, and content creator for over ten years, and loves making spreadsheets and documents in his spare time. Tony is also an academic proofreader, experienced in reading, editing, and formatting over 3 million words of personal statements, resumes, reference letters, research proposals, and dissertations. Before joining How-To Geek, Tony formatted and wrote documents for legal firms, including contracts, Wills, and Powers of Attorney. Tony is obsessed with Microsoft Office! He will find any reason to create a spreadsheet, exploring ways to add complex formulas and discover new ways to make data tick. He also takes pride in producing Word documents that look the part. He has worked as a data manager in a secondary school in the UK and has years of experience in the classroom with Microsoft PowerPoint. He loves to encounter problems in Microsoft Office and use his expertise and legal-level training to find solutions. Outside of the Microsoft world, Tony is a keen dog owner and lover, football fan, astrophotographer, gardener, and golfer. I realized I didn't have a single place where I could see all my subscriptions, so I built a simple Excel tracker to bring them together. Since I set mine up, it's helped me cut more than $1,000 from my recurring expenses by showing me what I was paying, highlighting overlaps, and giving me time to act before renewals. You can download a free copy of this worksheet. When you click the link, you'll find the download button in the top-right corner of your screen. Then, edit the lookup tables and tracker rows to match your subscriptions. I started with a simple three-column table Entering the information I already know I started by creating an Excel table with three columns: Service, Cost, and Last paid. The "Cost" column uses the Accounting number format, and the "Last paid" column uses a Date format. These are the only pieces of information I need to type manually for each subscription. I know the name of the service, how much it costs, and when I last paid for it. Excel can work out the rest. The subscriptions and figures shown in the worksheet screenshots are illustrative. Putting everything in one place is useful in itself. Instead of searching through emails, bank statements, and my memory, I can see all my recurring payments together. That makes potential overlaps much easier to spot and gives me a clear list of subscriptions to reconsider. In my case, seeing Google One and Dropbox alongside Microsoft 365 showed me I was paying for overlapping storage. Microsoft 365 already gave me 1TB, so I dropped the other two and saved around $140 a year. I added drop-down menus for categories and billing Data validation keeps the information consistent Next, I added Category and Billing columns to the table, both with the General number format applied. The "Category" column lets me group subscriptions such as streaming, software, cloud storage, fitness, and memberships, while the "Billing" column records whether I'm paying monthly, quarterly, or annually. Rather than typing these values manually, I use drop-down lists created with data validation. The main reason for this is to ensure my categories are consistent. If I entered "Cloud storage" for one service and "Cloud" for another, Excel would treat them as different categories, making it harder to see how much I'm spending in each area. Keeping the labels consistent means I can group and compare my spending more reliably. First, I created two small Excel tables beside my main subscription table. One contains the categories, while the other contains the three billing options. I then selected the relevant table column, went to Data > Data Validation, chose List, and pointed the Source to the appropriate lookup table. There's a slightly odd Excel quirk behind the way I've set this up. You can't use a structured table reference directly in the Data Validation dialog box. If you point data validation directly at cells on another worksheet, the range won't automatically expand when you add another item by default. Keeping the lookup tables on the same worksheet avoids that extra complication. This means I can add a new category later without having to rebuild the list. Excel calculates the costs and renewal dates for me Three formulas turn a basic list into a useful tracker The final three columns I added were calculated columns: Annual cost (Accounting), Next renewal (Date), and Alert (General). For the annual cost, I used: =IF([@Cost]="","",IF([@Billing]="Monthly",[@Cost]*12,IF([@Billing]="Quarterly",[@Cost]*4,[@Cost]))) A monthly subscription can look quite different when Excel shows what it adds up to over a year. In my personal tracker, seeing those annual costs prompted me to cancel YouTube Premium, saving me about $200 a year, as well as Adobe Acrobat Pro, which saved around $240. Next, I used EDATE to calculate the next renewal date: =IF([@[Last paid]]="","",EDATE([@[Last paid]],IF([@Billing]="Monthly",1,IF([@Billing]="Quarterly",3,12)))) EDATE moves a date forward by a specified number of months. The formula therefore adds one month for monthly subscriptions, three months for quarterly subscriptions, and 12 months for annual subscriptions. Then, the alerts tell me when I need to pay attention: =IF([@[Next renewal]]="","",IF([@[Next renewal]]-TODAY() Highlight Cells Rules > Text that Contains to format the three alert messages. I used Excel's default green, yellow, and red formatting presets, so the warnings are easy to spot without creating complicated formatting rules. This system is useful because I don't want to find out about a renewal after the money has already left my account. The warning gives me time to compare prices, switch providers, or negotiate before I'm committed to another payment. In my experience, this is where I usually make the biggest savings on automatic renewals like car insurance, roadside assistance, and my internet service. Across those changes, I've cut more than $450 from my annual recurring expenses. I added a slicer to make the list easier to explore This is optional, but useful when the table gets bigger Once the tracker was working, I added a slicer for the "Category" column. I selected the table, headed to Table Design > Insert Slicer, and selected Category. Now I can click a category to see only those subscriptions. For example, selecting "Software" immediately brings my software subscriptions together. It gives me a quick way to compare what I'm spending in that category and spot services I might be able to cut or replace. Place the slicer above your table and arrange it into multiple columns (Slicer > Columns) so it matches the table's width. This keeps the tracker compact and makes the slicer easier to scan. You can also add a "Billing" slicer if you want to filter the tracker by monthly, quarterly, or annual payments, but the "Category" slicer is the one I find most useful for seeing where I'm spending the most and deciding where I can cut back. Excel can be a surprisingly reliable companion Excel isn't just for accountants and analysts. I've found that it's also surprisingly useful for managing everyday life, whether that's spotting patterns in your daily routines or using a spreadsheet as a personal journal. In this case, a few simple formulas helped me take control of recurring expenses and keep more of my money. That's a pretty good use for a spreadsheet.
I saved over $1,000 after building this simple Excel subscription tracker
Full Article
Original Source
Read the full article at Howtogeek →KhanList aggregates and links to publicly available news content. We do not host full articles from third-party sources. Always verify important information with original sources.