
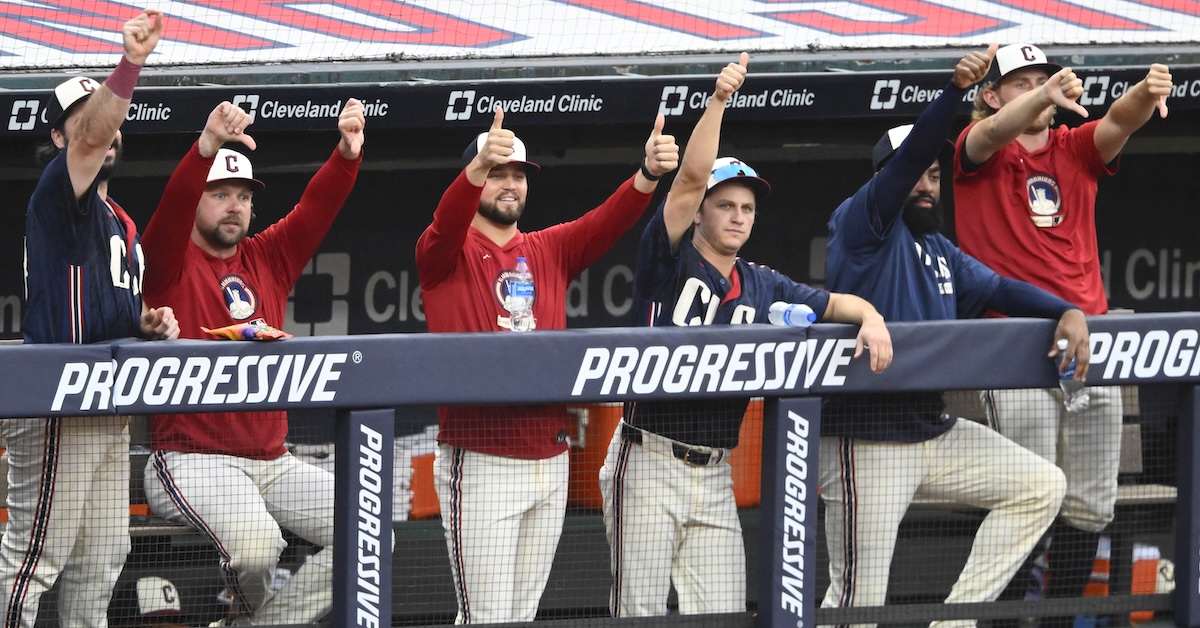
David Richard-Imagn Images Summer is nearly over. The Premier League is back in business and the NFL is close behind. Kids are going back to school. The other day, I opened a window and it didn’t feel like sticking my face in a pizza oven. That means it’s time for me to look at the Cleveland Guardians’ lineup and wonder what the heck they’re doing in the playoff race. But rather than do a deep dive on whoever this year’s load-bearing Tyler Naquin or Owen Miller is, I want to take a step back and look at this issue from a historical perspective. Because this year, the Guardians aren’t the only team with playoff aspirations and a lineup full of question marks. Another recurring theme of my analysis is concern trolling about the Brewers’ offense in the playoffs. Every year, they develop a slew of pitchers and play great fundamental baseball en route to winning oodles of regular season games. And every October, the lack of real thumpers in the lineup comes back to bite them. Against tougher postseason competition, they can’t string together as many singles and walks, the offensive fire hose kinks up, and instead of a torrent of runs, they have to make do with a dribble. A week or two ago, I was looking at the offensive stats for various National League contenders and reached an alarming conclusion. In 2021, when I got too hyped about the Brewers’ pitching staff, picked them to win the World Series, and got embarrassed, their offense was poor: a 92 wRC+ and 4.56 runs scored per game. Those figures ranked 11th and sixth, respectively, in the NL. It was a great pitching staff, undone by a poor offense. In the interest of painting the full picture, the word I used at the time wasn’t “poor.” It was a compound word that combined an offensive euphemism for the byproduct of digestion with an offensive euphemism for the orifice from which said byproduct is extruded. I’ll let you put the pieces together from there. You Aren't a FanGraphs Member It looks like you aren't yet a FanGraphs Member (or aren't logged in). We aren't mad, just disappointed. We get it. You want to read this article. But before we let you get back to it, we'd like to point out a few of the good reasons why you should become a Member. 1. Ad Free viewing! We won't bug you with this ad, or any other. 2. Unlimited articles! Non-Members only get to read 10 free articles a month. Members never get cut off. 3. Dark mode and Classic mode! 4. Custom player page dashboards! Choose the player cards you want, in the order you want them. 5. One-click data exports! Export our projections and leaderboards for your personal projects. 6. Remove the photos on the home page! (Honestly, this doesn't sound so great to us, but some people wanted it, and we like to give our Members what they want.) 7. Even more Steamer projections! We have handedness, percentile, and context neutral projections available for Members only. 8. Get FanGraphs Walk-Off, a customized year end review! Find out exactly how you used FanGraphs this year, and how that compares to other Members. Don't be a victim of FOMO. 9. A weekly mailbag column, exclusively for Members. 10. Help support FanGraphs and our entire staff! Our Members provide us with critical resources to improve the site and deliver new features! We hope you'll consider a Membership today, for yourself or as a gift! And we realize this has been an awfully long sales pitch, so we've also removed all the other ads in this article. We didn't want to overdo it. In 2024, the Brewers were 11th in the majors in wRC+. Last year, they were ninth. This year, they’re fourth. But their wRC+ figure has stayed more or less the same: 105 in 2024, 107 in 2025, 105 this year. Maybe Jake Bauers’ late-in-life offensive breakout and Jackson Chourio’s maturation have actually resulted in a Brewers offense that is not best described by that scatological portmanteau. Or maybe, in 2026 every offense can be so characterized: The Mediocre Offenses of Baseball Team R/G R/G+ wRC+ Playoff Odds CHC 5.23 117.1 114.0 99.2 WSN 5.23 116.9 106.2 0.0 LAD 4.98 111.5 110.5 100.0 MIL 4.96 111.0 104.8 100.0 PIT 4.93 110.3 101.6 1.7 CHW 4.73 105.8 103.8 65.7 COL 4.73 105.8 90.7 0.0 ATL 4.69 104.8 98.4 99.3 MIN 4.61 103.2 104.0 23.5 PHI 4.55 101.8 93.9 94.6 HOU 4.55 101.7 103.6 42.5 ARI 4.53 101.3 96.9 30.1 BOS 4.53 101.2 102.7 98.7 TBR 4.51 100.9 106.0 100.0 DET 4.49 100.4 101.4 3.1 NYY 4.45 99.6 100.2 100.0 BAL 4.45 99.5 102.3 10.5 STL 4.43 99.1 95.5 3.2 MIA 4.36 97.4 100.8 4.9 ATH 4.35 97.3 93.8 0.0 SDP 4.29 95.9 99.4 67.1 KCR 4.24 94.9 97.2 0.0 NYM 4.17 93.2 94.6 0.0 LAA 4.08 91.3 93.4 0.0 CIN 4.07 91.0 90.0 0.0 SFG 4.03 90.1 97.1 0.0 TEX 4.03 90.1 101.7 49.5 CLE 4.02 90.0 93.5 51.3 SEA 3.95 88.4 100.7 38.6 TOR 3.95 88.3 92.4 16.6 Stats Current as of August 24 Actually, I take it back. The Cubs’ offense is legitimately good. But that’s it. R/G+ is each team’s runs per game stated as a percentage of this year’s major league average of 4.47. I didn’t normalize for park factors, which is why the Rockies are so high on this list, but you get the picture. The defining feature of the 2026 regular season is the morass of mediocrity in the playoff race. It doesn’t look like we’re headed toward a collision of 105-win teams in the playoffs, like we had in the 2018 ALCS or the 2021 NL Wild Card Game. But we’ve got a pretty good chance of this being the first full season since 2017 with no 100-loss teams, either. As a result, about three quarters of the league is just mediocre. Heading into Tuesday’s games, our projected standings had the White Sox as the only team in either the AL Central or AL West to finish above .500. Now, if I were the commissioner of this league, and I’d spent the past year banging the competitive balance drum so I could recreate the 2004-05 NHL lockout from first principles, I might feel foolish right about now. Good thing I’m not the commissioner. But I digress. In recent years, there’s been a near-perfect correlation between having a good offense and making the playoffs. Last year, 10 of the 12 playoff teams were among the top 12 in team wRC+. The two exceptions were the Reds, whose team picture is in the dictionary under “backed into the playoffs,” and the Guardians, whom I’ve already mentioned. In 2024, it was nine playoff teams in the top 13, plus the Diamondbacks, who missed the postseason on a tiebreaker. In 2023, it was 10 playoff teams in the top 12 in wRC+ again. There’s obviously enormous variation among the top-10 offenses, and many teams on that list could reasonably be described as pitching-first. But the short version is this: If you want to make the playoffs, you either need to finish in the top 10 or 12 in the league in wRC+ or play in the AL Central. That’s less true this year. As I write this, seven of the 12 teams that currently inhabit a playoff position are in the top 12 in wRC+. The other five are all below the median, including the Phillies and Guardians, who are in the bottom seven. A few of the best offenses in the league are saddled with pitching staffs, especially bullpens, that have played them out of contention. (Imagine telling a Pirates fan in April that they’d end up scoring almost five runs a game and have 1.7% playoff odds in the last week of August.) Mostly, it seems like everyone except the Cubs, who are scoring 5.23 runs per game with a 114 wRC+, is stuck on the proverbial treadmill of mediocrity this year. But some teams are more mediocre than others. The Guardians are currently (i.e., before Tuesday’s games) scoring 4.02 runs per game with a 51.3% chance of making the postseason. They’re on track to be the lowest-scoring playoff team since… last year’s Guardians, actually. They were the first team since the 2015 Cardinals to make the playoffs while scoring fewer than 4.0 runs per game. That’s a provocative fun fact, but it gets better. Here’s the big league average in runs scored per team game, every year since the first World Series: As you can see, the mid-2010s were a pretty low-scoring time in modern baseball history. Over time, the ball changes, the mound changes, the strike zone changes. We have steroids, the DH, and Babe Ruth. You have to adjust for era. And for a little under 50 years of baseball history, you have to adjust for league: When the AL and NL had different DH rules (1973 to 2019, plus 2021), it was tough for an NL team to put up an above-average wRC+. There were 655 distinct seasons by NL teams during the split-DH rule era; only 138 of those teams put up a wRC+ of 100 or better. Only 47 posted a wRC+ of 105 or better, and only 12 got to 110. But the AL and NL had a unified DH rule from 1901 to 1972, and again in 2020 and from 2022 onward. In those seasons, you can make an apples-to-apples comparison of team offense using wRC+. In fact, let’s do that: Playoff Teams with the Worst wRC+ in Unified DH Seasons Season Team wRC+ R/G MLB Average R/G 1969 NYM 86.0 3.90 4.07 2025 CLE 86.1 3.97 4.45 2020 CIN 86.7 4.05 4.65 2020 MIL 89.9 4.12 4.65 2020 CLE 90.2 4.13 4.65 1959 LAD 90.2 4.52 4.38 1944 SLB 90.3 4.44 3.57 1914 BSN 90.5 4.16 2.50 1965 LAD 91.4 3.75 3.99 1906 CHW 91.7 3.68 3.62 Here we have a few teams with incredible front-end pitching talent (the Miracle Mets and the two Koufax-Drysdale Dodger teams), some Dead Ball-Era teams, four seasons played among ongoing worldwide calamity, and last year’s Guardians. (For the record: I have no idea what’s up with the 1914 Braves; they played 49 home games at the South End Grounds and 27 at Fenway Park, which could accommodate bigger crowds. Maybe that screwed with the park adjustment.) For years in which the AL and NL had the same DH rule, I used the major league average as the baseline for R/G+. For all other seasons (1973-2019 and 2021), I used the AL or NL average. The four worst R/G+ marks by playoff teams all came in 2020, which is the shortest major league season on record and also featured the largest playoff field. That’s to be expected, I suppose. The 1981 Astros, who played the odd strike-induced split-season playoff format, are also among the leaders. So let’s set a 140-game minimum to weed out the outliers: Playoff Teams with the Worst R/G+ Season Team R/G R/G+ G Runs wRC+ League R/G Unified DH Rule League 2023 MIA 4.11 89.1 162 666 93.2 4.62 Yes NL 2025 CLE 3.97 89.2 162 643 86.1 4.45 Yes AL 1973 NYM 3.78 91.0 161 608 85.2 4.15 No NL 1996 LAD 4.34 92.6 162 703 90.6 4.68 No NL 1985 KCR 4.24 93.1 162 687 92.9 4.56 No AL 2016 NYM 4.14 93.3 162 671 98.8 4.44 No NL 2007 ARI 4.40 93.4 162 712 82.1 4.71 No NL 1966 LAD 3.74 93.7 162 606 96.6 3.99 Yes NL 1965 LAD 3.75 94.1 162 608 91.4 3.99 Yes NL 2006 SDP 4.51 94.7 162 731 98.8 4.76 No NL Again, we have multiple Koufax-Drysdale Dodgers teams and a Tom Seaver–Jerry Koosman Mets team. I’m inclined to loop the 2016 Mets, who had the Four Horsemen or the Second Generation K or whatever you want to call it, in among those teams with great pitching staffs. So too the 1985 Royals, who had three top-five Cy Young finishers in Bret Saberhagen, Dan Quisenberry, and Charlie Leibrandt. The 1996 Dodgers and 2006 Padres were forgettable teams that played in extreme pitchers’ parks; if I had adjusted for park factors, they’d probably be lower on the list. But the 1973 Mets, even with their bonkers pitching staff, won only 82 games, the lowest total of any World Series participant in a 162-game season. The 2007 Diamondbacks were the top seed in the NL playoff bracket despite a -20 run differential. And the 2023 Marlins snuck into the playoffs at 84-78, with a Pythagorean record of 75-87. (Many thanks to Tanner Scott, who posted a 2.31 ERA in about a thousand high-leverage relief innings that year.) Again: Either great pitchers, park factor flukes, or the worst playoff teams in recent memory. Or 2026 in the American League. Right now, the Blue Jays and Mariners both have double-digit playoff odds, and would come in below the 2023 Marlins in R/G+. The Guardians and Rangers, both of whom are a coin flip to make the playoffs, would come in under the 1973 Mets to make the historical top three. And while this is mostly the fault of the AL — in the league of offenses that invite the offensive description I mentioned earlier, the team with one bat is king — the Padres are 67.1% to make the playoffs, with a wRC+ of 99.4 and a R/G+ of 95.9. That would place them 21st from the bottom historically, if you eliminate sub-140-game seasons. We’re now in year five of the 12-team playoff format, and in that time, the only constant has been a new narrative to gripe about every year. First, the top seeds had it too hard and the bye was a fatal hindrance. Then the top seeds had it too easy. Now the Dodgers are apparently going to win every year, so why bother with the pretense of having a playoff at all? I try not to overreact to a single year’s worth of information. Only a fool would try to rewrite the rules every offseason to try to solve last year’s problems, when each campaign brings up a new and unpredictable series of events. So I’m not drawing any sweeping conclusions or suggesting any structural changes. Nevertheless, this is a lot of competitive balance. Actually, I think I stepped in some competitive balance just now. Someone find me a stick so I can scrape it off my shoe.
Get Ready for Some Historically Bad Postseason Offense
Full Article
Original Source
Read the full article at Blogs →KhanList aggregates and links to publicly available news content. We do not host full articles from third-party sources. Always verify important information with original sources.