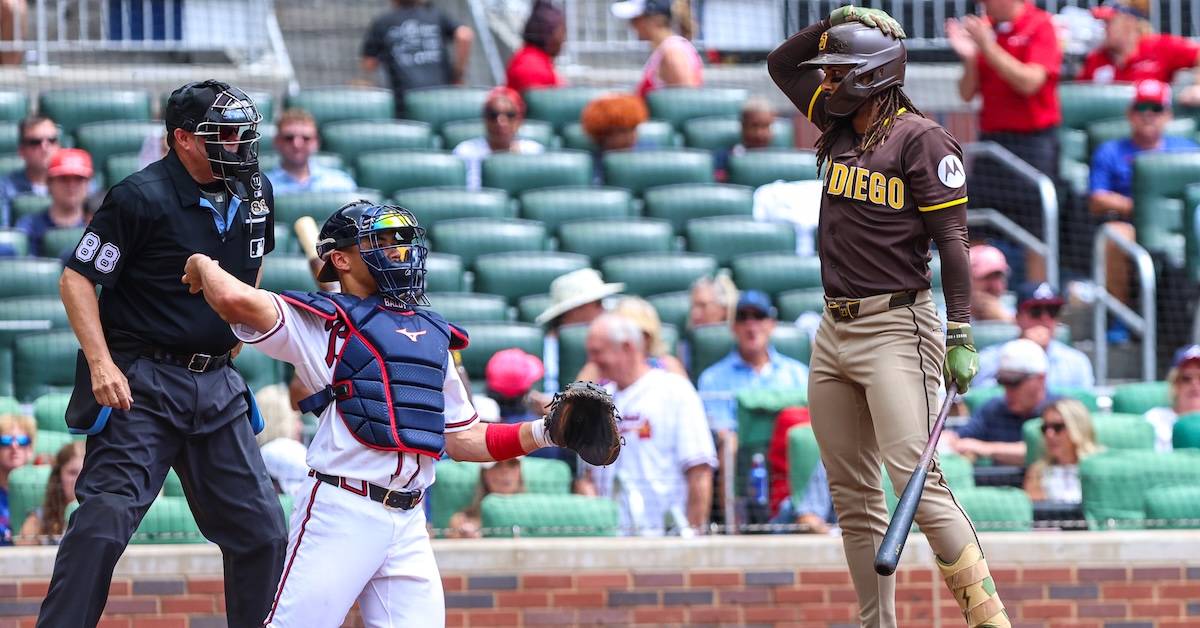
Jordan Godfree-Imagn Images Over the weekend, a friend of mine asked if ABS challenge data gets incorporated into WAR. (I have extremely cool friends.) It doesn’t, and I explained that while an individual challenge can absolutely change the course of an inning (or a game, or even a season), a single ball-strike call is of negligible run value out of context. If anything, we should be adding challenges to WPA, not WAR, except WPA only gets calculated on a per-plate-appearance basis, rather than a per-pitch basis. At any rate, challenges aren’t like catcher framing in the early days. In 2008, the first year for which we have framing data, the difference between the best framer in baseball (Brian McCann) and the worst (Ryan Doumit, the poor guy) was 97.7 runs. At 10 runs per win, well, you can do the math on your own. Doumit was an outlier, some 36 runs adrift of the back of the pack. In 2007, he was a 2.1-WAR player, with a 109 wRC+ in 279 plate appearances. Add in framing data, and in 2008 Doumit increased his offensive output to a 123 wRC+ in 265 plate appearances… and lost more than five wins, finishing at -3.1 WAR. McCann, who was one of three catchers with 30 or more framing runs, posted 8.3 WAR, thanks to a .301/.373/.523 batting line from behind the plate. That made him the second-most valuable position player in the league that year, trailing only Albert Pujols. Once the implications of framing became clear, the gap closed quickly. If the Pirates had known then what we know now, Doumit would’ve been a first baseman or an outfielder. Those who stayed behind the plate quickly learned pitch framing as an art. In 2008, the difference between the best and worst framers in the league (taking Doumit out of the equation for a moment) was about 60 runs. In 2025, the gap was half that size. If you disregard another outlier (a good one this time, Patrick Bailey), every catcher in the league was within 10 runs either side of average, give or take a run or two. Challenges aren’t like that. Everyone has known from the start that they’re being watched, so this is a skill everyone has known they had to strategize for. And insofar as challenging ball-strike calls is a skill, it’s one that only gets deployed a couple times per game, rather than dozens. You Aren't a FanGraphs Member It looks like you aren't yet a FanGraphs Member (or aren't logged in). We aren't mad, just disappointed. We get it. You want to read this article. But before we let you get back to it, we'd like to point out a few of the good reasons why you should become a Member. 1. Ad Free viewing! We won't bug you with this ad, or any other. 2. Unlimited articles! Non-Members only get to read 10 free articles a month. Members never get cut off. 3. Dark mode and Classic mode! 4. Custom player page dashboards! Choose the player cards you want, in the order you want them. 5. One-click data exports! Export our projections and leaderboards for your personal projects. 6. Remove the photos on the home page! (Honestly, this doesn't sound so great to us, but some people wanted it, and we like to give our Members what they want.) 7. Even more Steamer projections! We have handedness, percentile, and context neutral projections available for Members only. 8. Get FanGraphs Walk-Off, a customized year end review! Find out exactly how you used FanGraphs this year, and how that compares to other Members. Don't be a victim of FOMO. 9. A weekly mailbag column, exclusively for Members. 10. Help support FanGraphs and our entire staff! Our Members provide us with critical resources to improve the site and deliver new features! We hope you'll consider a Membership today, for yourself or as a gift! And we realize this has been an awfully long sales pitch, so we've also removed all the other ads in this article. We didn't want to overdo it. Through this past weekend, Sal Stewart leads the league in run value from challenges won, with 3.7. This metric is a counting stat, unlike framing, which is pegged to league average. There’s no direct penalty for losing a challenge, and while it’s probably possible to quantify the opportunity cost of losing a challenge, I know I’m nowhere near good enough at math to take that problem on. It seems like more trouble than it’s worth. That means that Stewart, who’s won 23 challenges, gets his 3.7 runs. Troy Johnston, who’s challenged a league-leading six times without a win, gets zero. That’s a rounding error, in the world of WAR. But batter challenges are a small piece of the puzzle. The opposing pitcher and catcher can challenge as well, and catchers get credit for challenges they initiate while on defense. (Whether it’s fair to debit a hitter for challenges initiated against him is a reasonable methodological question, but I’m going to do it anyway.) The catcher who’s profited most from challenging this season has been Shea Langeliers, who’s 52-for-86 behind the plate, racking up 7.19 runs. Langeliers, somewhat puzzlingly, has only challenged once as a hitter, but even so, he leads all position players with 6.55 total challenge runs. At the other end of the spectrum is James Wood, who is a pretty shocking 6-for-19 on challenges. Opposing catchers, by contrast, have won 23 of 35 challenges on pitches thrown to Wood, costing him 4.55 runs. That’s the largest figure in the league by a huge margin: three quarters of a run over second-place Ian Happ, and a full run over third-place Brett Baty. On the whole, Wood is 3.65 runs in the red on challenges. Sucks to be tall in the world of ABS, I guess. The 10 Most ABS-Friendly Hitters Name Total Rev. Batter Rev. Overturned Pct. Runs Opp. Rev. Overturned Runs Total Cal Raleigh 22 15 10 66.7% 3.36 7 4 -0.66 2.70 Sal Stewart 57 41 23 56.1% 3.71 16 9 -1.27 2.43 José Caballero 33 24 14 58.3% 2.25 9 3 -0.31 1.93 Kyle Karros 28 15 9 60.0% 2.73 13 4 -0.83 1.91 Bryan Reynolds 38 19 10 52.6% 3.59 19 13 -1.70 1.89 Nolan Schanuel 51 33 19 57.6% 3.40 18 13 -1.68 1.72 Ronald Acuña Jr. 26 17 7 41.2% 1.71 9 0 0.00 1.71 Coby Mayo 18 12 7 58.3% 1.71 6 1 -0.18 1.53 Juan Soto 30 16 10 62.5% 2.28 14 7 -0.76 1.52 Heliot Ramos 17 14 8 57.1% 1.52 3 1 -0.08 1.44 Through 8/9, minimum 5 total reviews Good to see that something’s going right for Raleigh this year. So there’s about a win’s worth of difference between the best challenger this year (Langeliers) and the greatest victim of ABS (Wood). Take out catcher defense and that gap gets narrowed down to about six runs. Looking at the leaderboard got me curious. Stewart leads the league in challenge runs and in successful challenges. But that’s the result of a spray-and-pray approach. Stewart has challenged 41 calls this year, which is the most in the league. He’s also tied for the league lead in unsuccessful hitter challenges. With no penalty for missing a challenge (at least not by this metric), quantity has a quality all its own. The second-most successful catcher on the challenge leaderboard is Tyler Stephenson. And in contrast to Langeliers, he’s made five challenges from the batter’s box and won all of them. The only other hitter with as many challenges and a perfect record is Matt McLain, who — like Stephenson and Stewart — is a member of the Cincinnati Reds. Obviously, some teams will have benefited from ABS more than others. ABS Success and Run Value by Team Position Batter Pitcher+Catcher Total Team Rev. OvrTrn Pct. Runs Rev. OvrTrn Pct. Runs Rev. OvrTrn Pct. Runs MIN 141 67 47.5% 12.0 187 114 61.0% 21.5 328 181 55.2% 33.6 ATH 107 53 49.5% 9.0 168 104 61.9% 21.9 275 157 57.1% 31.0 CIN 125 67 53.6% 13.5 138 99 71.7% 16.4 263 166 63.1% 29.9 COL 131 57 43.5% 10.4 154 97 63.0% 17.3 285 154 54.0% 27.8 LAA 133 59 44.4% 13.5 138 84 60.9% 14.0 271 143 52.8% 27.4 MIA 105 52 49.5% 10.7 174 104 59.8% 16.3 279 156 55.9% 27.1 NYY 140 70 50.0% 12.0 158 92 58.2% 14.8 298 162 54.4% 26.8 NYM 148 74 50.0% 12.0 135 73 54.1% 13.5 283 147 51.9% 25.5 KCR 114 64 56.1% 12.0 140 80 57.1% 13.0 254 144 56.7% 25.0 BOS 114 56 49.1% 11.9 109 62 56.9% 12.8 223 118 52.9% 24.7 BAL 125 61 48.8% 13.3 110 56 50.9% 10.8 235 117 49.8% 24.1 DET 119 64 53.8% 11.8 113 76 67.3% 12.2 232 140 60.3% 24.1 MIL 86 38 44.2% 7.0 184 100 54.3% 16.8 270 138 51.1% 23.7 HOU 132 75 56.8% 12.9 141 72 51.1% 10.6 273 147 53.8% 23.5 CHC 115 56 48.7% 11.1 118 79 66.9% 12.3 233 135 57.9% 23.4 LAD 121 65 53.7% 13.4 101 61 60.4% 9.9 222 126 56.8% 23.3 SEA 119 52 43.7% 11.1 112 66 58.9% 11.9 231 118 51.1% 23.1 CHW 108 49 45.4% 8.3 189 87 46.0% 14.5 297 136 45.8% 22.7 ATL 101 38 37.6% 8.8 124 75 60.5% 13.8 225 113 50.2% 22.6 TEX 102 51 50.0% 10.7 113 72 63.7% 11.6 215 123 57.2% 22.3 TOR 112 56 50.0% 9.3 134 76 56.7% 12.7 246 132 53.7% 22.0 PHI 133 66 49.6% 10.0 104 67 64.4% 11.9 237 133 56.1% 21.9 SFG 117 57 48.7% 11.4 118 62 52.5% 9.9 235 119 50.6% 21.3 CLE 116 46 39.7% 8.8 131 67 51.1% 12.1 247 113 45.7% 20.9 ARI 100 55 55.0% 9.0 109 73 67.0% 11.5 209 128 61.2% 20.5 STL 99 47 47.5% 7.8 113 64 56.6% 12.5 212 111 52.4% 20.3 WSN 95 41 43.2% 7.5 152 83 54.6% 12.3 247 124 50.2% 19.8 PIT 129 58 45.0% 11.3 117 53 45.3% 8.3 246 111 45.1% 19.6 SDP 89 38 42.7% 6.3 139 79 56.8% 12.8 228 117 51.3% 19.1 TBR 103 45 43.7% 6.7 128 75 58.6% 11.4 231 120 51.9% 18.1 Through 8/9 Again, the volume approach pays off. Across all positions, the Twins have initiated 30 more challenges than the second-place team. But the Reds not only have the highest challenge success rate in the league, they’re getting the most value per challenge out of any team. Challenge Efficiency by Team Team Challenges Win% Runs Runs/Challenge CIN 263 63.1% 29.9 0.114 ATH 275 57.1% 31.0 0.113 BOS 223 52.9% 24.7 0.111 LAD 222 56.8% 23.3 0.105 TEX 215 57.2% 22.3 0.104 DET 232 60.3% 24.1 0.104 BAL 235 49.8% 24.1 0.102 MIN 328 55.2% 33.6 0.102 LAA 271 52.8% 27.4 0.101 ATL 225 50.2% 22.6 0.100 CHC 233 57.9% 23.4 0.100 SEA 231 51.1% 23.1 0.100 KCR 254 56.7% 25.0 0.098 ARI 209 61.2% 20.5 0.098 COL 285 54.0% 27.8 0.097 MIA 279 55.9% 27.1 0.097 STL 212 52.4% 20.3 0.096 PHI 237 56.1% 21.9 0.092 SFG 235 50.6% 21.3 0.091 NYM 283 51.9% 25.5 0.090 NYY 298 54.4% 26.8 0.090 TOR 246 53.7% 22.0 0.090 MIL 270 51.1% 23.7 0.088 HOU 273 53.8% 23.5 0.086 CLE 247 45.7% 20.9 0.085 SDP 228 51.3% 19.1 0.084 WSN 247 50.2% 19.8 0.080 PIT 246 45.1% 19.6 0.080 TBR 231 51.9% 18.1 0.078 CHW 297 45.8% 22.7 0.077 Through 8/9 The margins, as you can see, are small. The Reds are one one-thousandth of a run per challenge better than the A’s, and just 0.037 runs per challenge better than the last-place White Sox. That comes to one additional win every 270 challenges; at the current league-average challenge rate, that’s a difference of an extra win and a quarter over a 162-game season. Here’s a graph of the relationship between total challenges and runs earned from challenges, by team. It’s called “Total Challenges vs. Runs, by Team.” There’s a strong correlation between number of challenges and runs won from challenges. The correlation between challenge success rate and challenge runs is still strong, but not as much as the raw challenge figure. Which makes sense, considering the lack of penalties for an unsuccessful challenge. But you can see the teams that have benefited the most from their challenges are in the middle of the pack in success rate. The Reds are way over there on the right side of the chart with their 63.1% challenge win rate. Of the top 11 teams in challenge runs, everyone but Cincinnati is within one standard deviation of the league-average success rate. Given the data we have here, an extra 2.88% of challenge success rate leads to one additional run from challenges. At the same time, every 11.6 challenges — successful or otherwise — correlates to an additional run. It looks like teams, on the aggregate, could stand to be more aggressive. We know that’s true across plenty of situations within the game: Baserunning, manager challenges, using the backup catcher. An optimal strategy would occasionally leave a manager facing a serious downside; you don’t want to have rallies stifled by losing baserunners, or be forced to use the emergency catcher. But while prioritizing avoidance of disaster minimizes the number of awkward postgame press conference questions, it might not be the best guiding principle for winning baseball games. Ultimately, the effects of ABS challenges are minuscule on the whole; the best and worst teams, let alone players, are separated by little more than a run. But every edge counts. It’s time to loosen the reins.
Who’s Getting Their Money’s Worth From the ABS Challenge System?
Full Article
Original Source
Read the full article at Blogs →KhanList aggregates and links to publicly available news content. We do not host full articles from third-party sources. Always verify important information with original sources.