
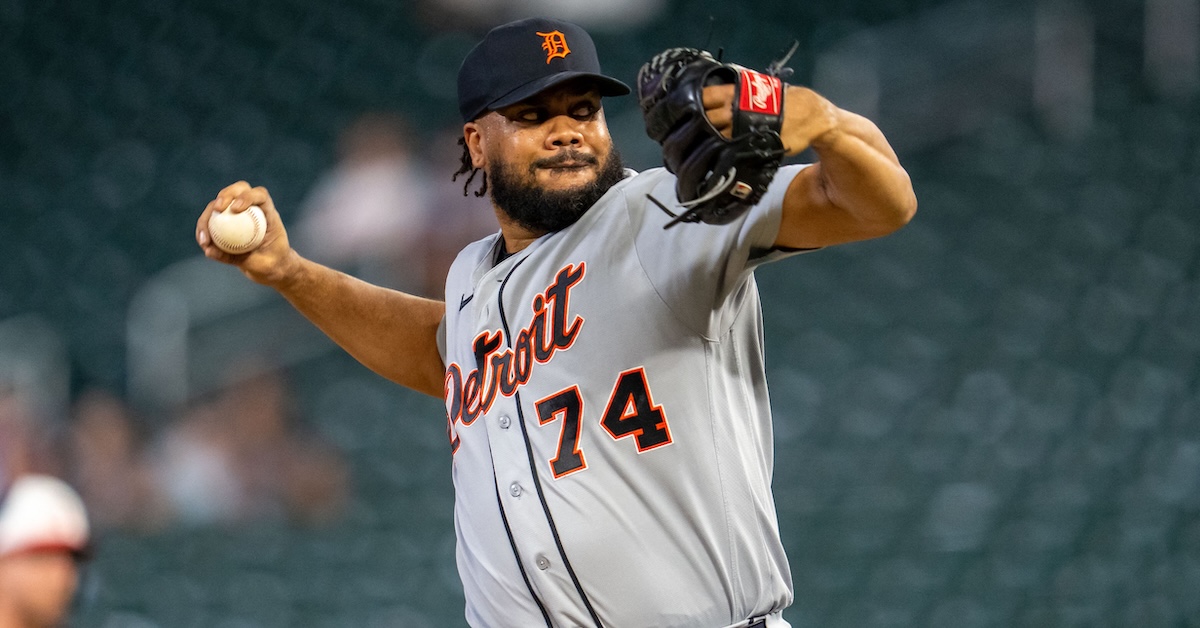
Jesse Johnson-Imagn Images It’s been a dismal and deflating season in Detroit. The Tigers, who entered the year as favorites to win the AL Central after signing both Framber Valdez and Justin Verlander in February, played middling baseball through the first five weeks of the season before hitting the skids in May, at one point losing 16 out of 18 games. Instead of loading up for the stretch run ahead of the August 3 trade deadline, they dealt away both Tarik Skubal and Casey Mize to other contenders. While the team has actually outscored opponents by 47 runs (610 to 563), the Tigers are currently 11 games below .500 at 64-75, and in danger of making some dubious history by falling short of their Pythagorean-projected win total by the largest margin of any Wild Card-era team. Misery loves company, and the Tigers are not alone in undershooting their target. The Giants, who at the outset of the season looked to have a reasonable chance of claiming a Wild Card berth, are not only 24 games below .500 (58-82) but in danger of falling short of their BaseRuns-projected win total by the largest margin of any team since 2002. If you’re not familiar with either of these concepts, a Pythagorean projection is one of the most enduring Bill James creations, introduced in his self-published 1980 Baseball Abstract. James showed that simply by knowing a team’s runs scored and runs allowed, one could estimate its winning percentage with a reasonable degree of accuracy via the formula Winning % = RS^2 /(RS^2 +RA^2). The use of the squares, reminiscent of the Pythagorean formula to calculate the length of a right triangle’s hypotenuse, is what gives the stat its name. Further refinements by James and other sabermetricians showed that using a slightly smaller exponent increased the accuracy of the estimate. The Pythagenpat formula, where the exponent itself is a function of the scoring environment via the formula X = ((RS + RA)/G)^0.287, is the one we use for our Projected Standings pages, which now have all major league seasons dating back to 1871 (damn those underachieving Rockford Forest Citys). Where Pythagorean projections use actual runs scored and allowed to estimate winning percentages, BaseRuns uses estimated runs scored and allowed, derived from familiar statistical components such as hits, walks, hit-by-pitches, stolen bases, and so on; those estimates are then run through the Pythagenpat formula for a second-order estimate of winning percentage. Both formulas provide useful if imperfect ways of measuring teams’ underlying performance and helping to identify outliers in either direction. In that regard, both Detroit and San Francisco stand out. Today I’ll focus on the Tigers, and how they’ve wound up at this historic juncture; I’ll follow up with a separate look at the Giants, though there will be some crossover. Here’s a look at the largest Pythagorean underachievers for all full seasons of the Wild Card era; I’ve excluded the strike-shortened 1995 season and the pandemic-shortened 2020 season but not this one: Largest Margin Between Actual and Pythagenpat-Projected Win Totals Team Season W L Win% RS RA Pyth Win% +/- Cleveland 2006 78 84 .481 870 782 .551 -11.27 Royals 1999 64 97 .398 856 921 .464 -10.78 Tigers 2026 64 75 .460 610 563 .538 -10.72 White Sox 2025 60 102 .370 647 742 .436 -10.67 Athletics* 2014 88 74 .543 729 572 .609 -10.64 Padres 2023 82 80 .506 752 648 .570 -10.33 Dodgers* 2018 92 71 .564 804 610 .626 -10.11 Yankees* 2017 91 71 .562 858 660 .622 -9.74 Astros* 1997 84 78 .519 777 660 .577 -9.52 Rockies 2001 73 89 .451 923 906 .509 -9.44 Athletics 2015 68 94 .420 694 729 .477 -9.32 Rangers 2022 68 94 .420 707 743 .477 -9.28 Rangers 2025 81 81 .500 684 605 .557 -9.27 Rockies 2014 66 96 .407 755 818 .464 -9.09 Blue Jays* 2015 93 69 .574 891 670 .629 -8.86 * = Qualified for postseason. Wow. The Tigers are a close third in the rankings, just “ahead” of last year’s White Sox on a leaderboard that includes some teams that nonetheless made the playoffs (the ones with asterisks), some that would have done so if their actual record resembled their projected one (such as the 2023 Padres and ’25 Rangers), some that ended up with godawful records (such as the 2014 Rockies and ’25 White Sox) instead of merely mediocre ones. You Aren't a FanGraphs Member It looks like you aren't yet a FanGraphs Member (or aren't logged in). We aren't mad, just disappointed. We get it. You want to read this article. But before we let you get back to it, we'd like to point out a few of the good reasons why you should become a Member. 1. Ad Free viewing! We won't bug you with this ad, or any other. 2. Unlimited articles! Non-Members only get to read 10 free articles a month. Members never get cut off. 3. Dark mode and Classic mode! 4. Custom player page dashboards! Choose the player cards you want, in the order you want them. 5. One-click data exports! Export our projections and leaderboards for your personal projects. 6. Remove the photos on the home page! (Honestly, this doesn't sound so great to us, but some people wanted it, and we like to give our Members what they want.) 7. Even more Steamer projections! We have handedness, percentile, and context neutral projections available for Members only. 8. Get FanGraphs Walk-Off, a customized year end review! Find out exactly how you used FanGraphs this year, and how that compares to other Members. Don't be a victim of FOMO. 9. A weekly mailbag column, exclusively for Members. 10. Help support FanGraphs and our entire staff! Our Members provide us with critical resources to improve the site and deliver new features! We hope you'll consider a Membership today, for yourself or as a gift! And we realize this has been an awfully long sales pitch, so we've also removed all the other ads in this article. We didn't want to overdo it. As the great sabermetrician Leo Tolstoy famously observed, “Happy teams are all alike; every unhappy team is unhappy in its own way.” Such is the case for the underperformers above. While I don’t have room to dig into them all, the Tigers are worth a closer look so we can understand their presence here. The biggest thing that stands out is the contrast between Detroit’s performance in blowouts — games decided by five or more runs — and in one-run games. Following back-to-back drubbings by the Twins on Monday (11-1) and Tuesday (15-2) and then an 11-6 extra-innings win over Minnesota on Wednesday, the Tigers are 23-14 in games decided by five or more runs, outscoring their opponents by 71 runs (238 to 167). Their .622 winning percentage in that context ranks fifth in the majors, behind the Brewers (.732, 30-11), Cubs (.696, 32-14), Dodgers (.659, 29-15), and Yankees (.636, 28-16) — all likely playoff-bound, as are the sixth-ranked Braves (.615, 24-15) and seventh-ranked Red Sox (.591, 26-18). The Tigers stick out like a sore thumb in that company. They stick out even further when it comes to one-run games, because the Tigers’ .361 winning percentage, via a 13-23 record, is the majors’ second-worst, ahead of only the Giants’ .324 (12-25). After their August 19 loss to the Pirates, a game in which closer Kenley Jansen served up a game-tying solo homer to Rafael Flores and then a game-winning solo homer to Brandon Lowe two batters later, they dropped to 12-22 in one-run games, with seven of those coming in walk-off losses. A headline on MLB.com declared, “Tigers’ troubling trend of 1-run losses starting to pile up,” but in truth, that concern was half a season late. The team went 5-13 in one-run games through the end of May, including a stretch where they lost 10 out of 11 such games from April 24 to May 31. They finished the month 22-38, at which point it was all over but the shouting of teams clamoring for Skubal. When teams perform poorly in one-run games, the bullpen is quite often the culprit, and that’s definitely true in this case. The bullpen’s 4.03 ERA ranks a middling 14th in the majors, but the team is second in blown saves (29). In the nomadic phase of his career, the 38-year-old Jansen has climbed to third all-time with 493 saves, but he’s blown six saves — one short of his career high — in just 23 chances, including one on Wednesday night; he ranks sixth in the majors in that category. Three of those blown saves were one-run losses on walk-off home runs (by the Reds’ Nathaniel Lowe on April 24, the Braves’ Matt Olson on April 29, and Lowe); a fourth was a two-run loss on a walk-off homer by the Orioles’ Colton Cowser on May 24. For a point of comparison, Jansen entered the season having allowed just seven walk-off homers from 2010 through last season, with just two during his time with the Dodgers (which ended in 2021), and more than one in a season just once (2023). Father Time remains undefeated. As for Jansen’s teammates, setup man Kyle Finnegan has been charged with nine blown saves, tied with Andrés Muñoz for the major league lead. Drew Anderson, who moved into the rotation after the trades of Skubal and Mize, and the now-injured Will Vest each have five, tied for 15th in the majors. According to Baseball Reference, the team has lost 17 games it led after six innings, the most in the majors; the Giants are third with such 15 losses. Leverage-based stats tell on the Tigers bullpen, too. The unit’s -4.86 WPA is the majors’ fifth-worst, with Jansen (-2.14) and Vest (-1.82) individually owning the second- and sixth-worst marks, and Anderson (-1.24 for his relief work) the 17th-worst. The bullpen’s -4.98 Clutch score — which tracks the difference between how much better a player does in high-leverage situations than in a context-neutral environment — is the majors’ second lowest, while their .360 wOBA allowed in high-leverage situations is the fourth highest, 54 points above the major league average. This isn’t to absolve the offense of responsibility, because it has withered in big moments, too. The Tigers’ .285 wOBA in high-leverage situations — including those against opposing starters — is the majors’ fourth lowest, 26 points below average. Likely American League Rookie of the Year Kevin McGonigle has been great, with a .377 wOBA in that context, as has the much-maligned Spencer Torkelson (.364), and Dillon Dingler (.300, via a walk-heavy .360 OBP but just a .256 SLG) has been better than average. On the other hand, Riley Greene (.258) and Gleyber Torres (.242) have withered, and Colt Keith (.217), Zach McKinstry (.206), and Matt Vierling (.188) have been even worse. The team’s -5.53 WPA ranks 23rd in the majors, with Vierling (-2.24) seventh lowest among all hitters, and Javier Báez (-1.72) 19th lowest despite missing three months due to a severe right ankle sprain. The team’s -2.80 Clutch score is the majors’ fourth lowest, and including their starting pitching, their overall combined Clutch score of -8.07 is ahead of only the Angels (-12.22) and Giants (-8.72). When trailing after six innings, they’ve come back to win eight times, which is middle of the pack — a six-way tie for 13th — but they’ve never come from further back than down two runs at that point. The Tigers made the playoffs as a Wild Card in each of the past two seasons in particularly adventurous fashion, surging late to snatch a berth in 2024, then squandering a 6.5-game AL Central lead with 12 games to play and settling for a Wild Card spot last season. Unfortunately for them, the 2026 squad sealed its fate early with so many close losses, and if this team is going to be remembered at all, it will be for a particularly dismal distinction.
The Tigers Have Been Kicked in the Pythagoras
Full Article
Original Source
Read the full article at Blogs →KhanList aggregates and links to publicly available news content. We do not host full articles from third-party sources. Always verify important information with original sources.