
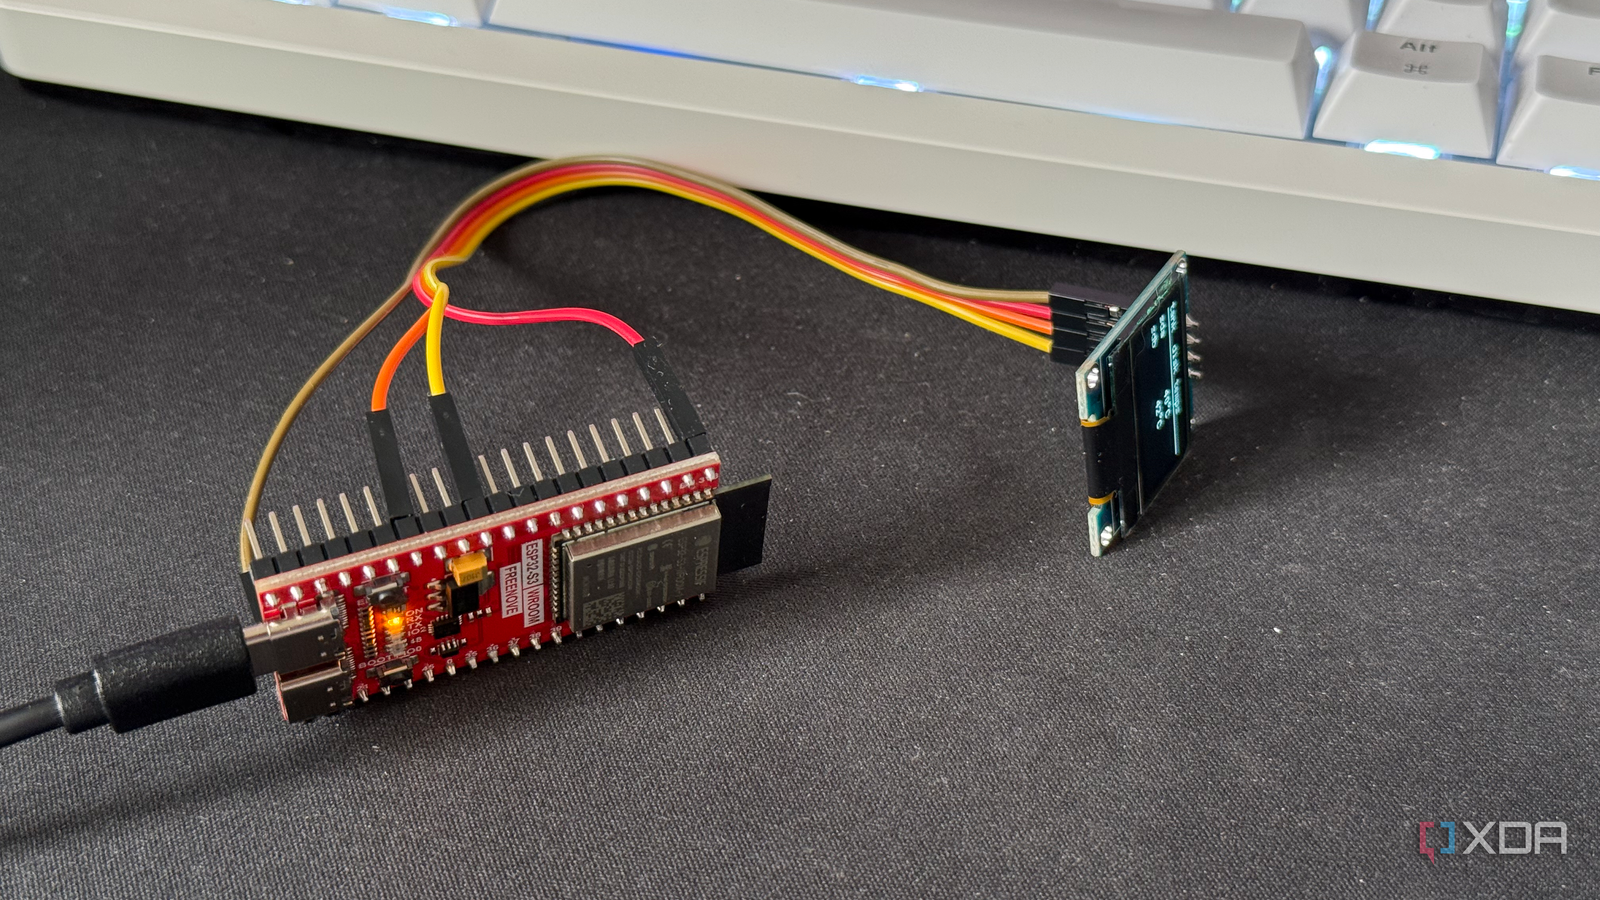
Published Aug 25, 2026, 12:31 PM EDT His love of PCs and their components was born out of trying to squeeze every ounce of performance out of the family computer. Tinkering with his own build at age 10 turned into building PCs for friends and family, fostering a passion that would ultimately take shape as a career path. Besides being the first call for tech support for those close to him, Ty is a computer science student, with his focus being cloud computing and networking. He also competed in semi-pro Counter-Strike for 8 years, making him intimately familiar with everything to do with peripherals. When you're building and maintaining a home lab, there's always a reflex to go and find software that does what you're looking for, and that's quite normal. If I want my machine to tell me something, there's almost always a self-hosted answer for that, and most of it is free and better-engineered than whatever I'd manage on a weekend. With that said, though, there is something to vibe-coding a bespoke purpose-built tool for your home lab, especially if nothing else has been able to satisfy a need. For me, that was keeping an eye on the temperature of the hardware within my server PC. It started with keeping an eye on the temperature of my SAS array using an ESP32, but the sky is the limit with a physical readout like this. Why a microcontroller instead of another browser tab Something physical I can easily glance at The driving force behind this project was a concerning temperature reading I had seen when doing the initial format of my 8TB SAS mirror. Proxmox ships with smartmontools, and while I could SSH in and just compulsively spam the smartctl command, I figured there must be an easier way to keep an eye on things, and I was also itching to use an ESP32 somewhere in my lab. A physical readout made sense to me. It's always on, uses practically zero power, and I can quickly glance at the digits it displays and move on. Plenty of people do keep Grafana open and glance at it, but having a clean physical readout felt better for my setup. An ESP32-S3 with a small OLED is very inexpensive, and all it needs is an active Wi-Fi connection. A quick Claude Code session and I had a readout It took all of about 30 minutes This build only has two parts, and it came together faster than I thought. The Proxmox host itself handles everything privileged: using a python script, it calls smartctl for the two Seagate Exos drives that are connected to my LSI card, pulling the current temperature out of the JSON and serves it on the local network as a tiny payload. It uses nothing but standard python and does require sudo, but it's not a full-on systemd unit. The microcontroller wakes on a timer, fetches that payload over Wi-Fi, and prints the temperatures to the display. It'll also flag anything past a threshold I set. The script reads smartmontools' normalized temperature field rather than the actual SMART attribute, because the latter is the ATA path. My drives are SAS, so this was the only way to approach this. It's also worth nothing that data only travels in one direction—the ESP32 never communications directly to the drives or HBA, nor does it have any kind of access to the data pool. It reads a few values and sends them to the display. A few lines of Python were all I needed There are more obvious tools, but they come with their own host of issues For those that run arrays of drives, Scrutiny is the obvious tool for this job, and it is better software than what I have written. It has a web dashboard, historical trending, and thresholds that are informed by real-world failure data, along with true alerts. To deliver all of this, it has to be correct across ATA, SATA, NVMe, SAS, and whatever RAID controller you use, and that's where the difficulty starts to show. There are multiple bug reports of SAS drives showing incorrect temperatures in the dashboard, and there's even a community fork whose headline feature is fixes for SAS drives specifically. As someone who runs SAS drives, this obviously matters to me. It doesn't make Scrutiny bad software, but it does make it more complex than what I need. I wanted something that would give me a quick readout from hardcoded drive names, and I didn't have to touch an IDE to do it. I also didn't have to vibecode anything particularly complex—pulling a handful of values from an existing tool and passing it over the network is a relatively trivial thing to do. Where vibecoding starts to become more of a headache than a simple install Adding complex features While the majority of this project went off without a hitch, if I were to add anything else complex on top of it, that's when the diminishing returns from vibecoding would begin to show almost immediately. If I did want to add a Scrutiny-style database, for example, that turns a simple Python script into something that would probably require me to spin up Docker in a separate LXC, and thus, introducing the potential for a whole host of additional bugs to troubleshoot. Adding a separate readout for my GPU or CPU, though, would be a handful of extra lines of code in the script. The less complex route is sometimes necessary This approach is scaling down what most people find adequate for temperature readouts, and for me, it works. There's no login or hosted web page, just a simple readout on a display I can place anywhere, and building it myself was easier than installing yet another service on my lab. With that said, building the solution can absolutely create more problems down the road, especially as complexity rises, so I wouldn't add much more on top of this project.
The best tool on my home server is the one nobody else can download
Full Article
Original Source
Read the full article at Xda-developers →KhanList aggregates and links to publicly available news content. We do not host full articles from third-party sources. Always verify important information with original sources.