
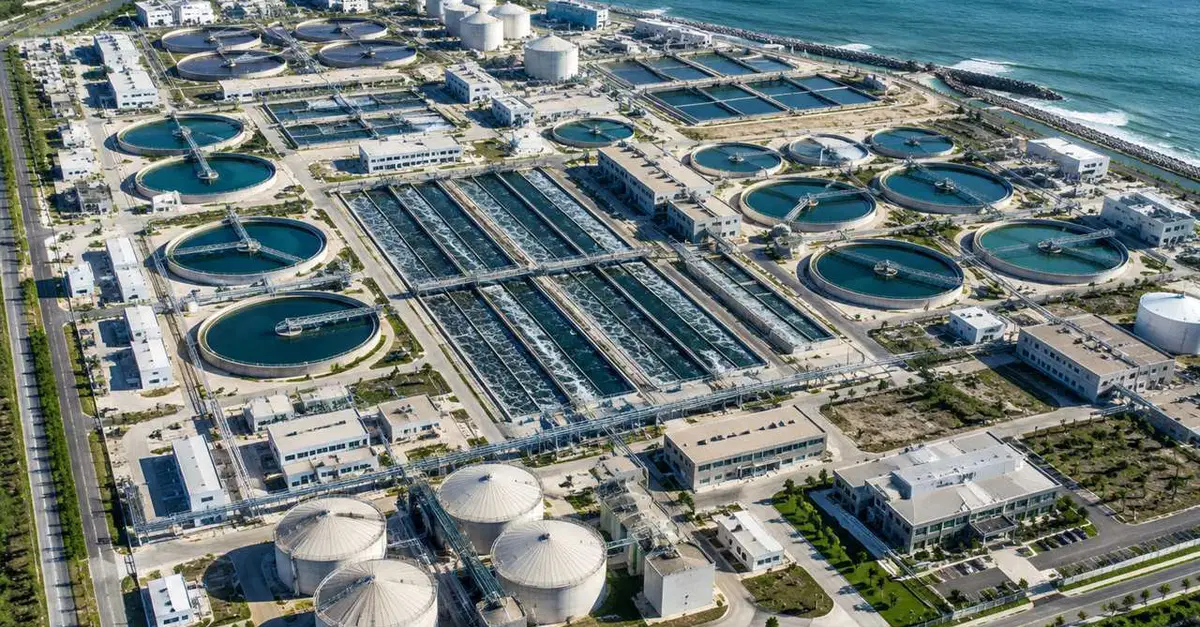
I spent a weekend trying to turn the Hyperion Water Reclamation Plant into something a computer could reason about. The first attempt was a mesh. The second was a diagram. The third, which finally worked, was a graph. The difference matters when you want the plant to answer a question, not just pose for a picture. What the box gives you I started with GenAnywhere, selecting the site, the shoreline, and a piece of the access road. The generated model came back quickly: circular tanks in rows, rectangular basins, buildings, and the coastal edge. As a site plan, it was useful. It gave me a boundary and a sense of the scale. Then I tried to trace a drop of water. Every tank was a shape, every pipe was missing, and the ocean had no connection to the plant. A generated model is a shell. It is not a process model, and it is not a survey. A plant is a directed graph The useful abstraction is a directed graph with unit processes as nodes and flows as edges. Raw influent enters at the headworks, where screens and grit removal come first, then primary clarification. The primary effluent goes to aeration basins, then secondary clarifiers, then disinfection, then the outfall. A side stream leaves primary and secondary treatment as sludge and enters a separate solids train: thickening, digestion, dewatering, hauling. Once the plant is a graph, questions become queries. What is the retention time in the aeration basins at 250 million gallons a day? Which units are bypassed during a storm? How much capacity is lost if one clarifier is drained for maintenance? A graph can answer these, as long as the nodes carry the right attributes. Capacity is not one number Hyperion is often described by a single figure, but the plant has several. The design average is around 450 million gallons per day. Peak wet-weather capacity reaches much higher, near 800 million. Actual dry-weather flow is usually closer to 250 million. Those numbers belong to different operating states. A model that stores one will often be wrong. Each unit has its own limit. A clarifier is limited by surface overflow rate and solids loading. An aeration basin is limited by oxygen transfer and mixed liquor concentration. A digester is limited by volatile solids loading and detention time. The plant's capacity is the minimum constraint along the path, not the nameplate on the gate. The second network: solids Most treatment models focus on water and forget the sludge. At Hyperion, the solids train is a network of its own: primary sludge, waste activated sludge, thickened feed, digested biosolids, and dewatered cake. Gas from digestion can be burned for heat or power. If your model does not represent solids, you cannot explain why a storm changes the plant's energy balance or why a digester upset shows up days later. I treat each solids stream as an edge with a solids concentration, a volatile fraction, and a flow. The nodes are thickeners, digesters, and dewatering units. The mass balance has to close at every node. When it does not, either a sensor is wrong or a valve is open that should not be. The outfall boundary Treated effluent exits by a five-mile outfall that reaches Santa Monica Bay. A smaller stream, roughly one-tenth of the total, is diverted to West Basin for further treatment and reuse. The outfall and the reuse plant are two different boundaries, and they need separate accounting. If you lump them together, you cannot answer the question a water manager asks first: how much is available for reuse? Three checks before you trust the model First, check the flow balance. Influent minus effluent minus solids withdrawal should match storage change within a small tolerance. If it does not, stop and find out why. Second, check the unit count. If your model has three secondary clarifiers and the plant has more, the capacity calculation is already wrong. Generated geometry is a start, but the count must come from an asset register or a site visit. Third, check the time constants. A clarifier responds in hours. A digester responds in weeks. A model with one time step for both will produce confident nonsense. Where the box stops I still use GenAnywhere at the start of every model. It gives me the footprint, the tank layout, and a quick way to explain the site to a newcomer. But the box cannot see the pipes, the flow directions, the sensors, or the permits. Those come from drawings, operations data, and conversations with the people who run the plant. The generated model is the outline. The graph is the plant.
Modeling Hyperion from a Map Box: Tanks, Pipes, and the Process Graph Behind the Plant
Full Article
Original Source
Read the full article at Dev →KhanList aggregates and links to publicly available news content. We do not host full articles from third-party sources. Always verify important information with original sources.