
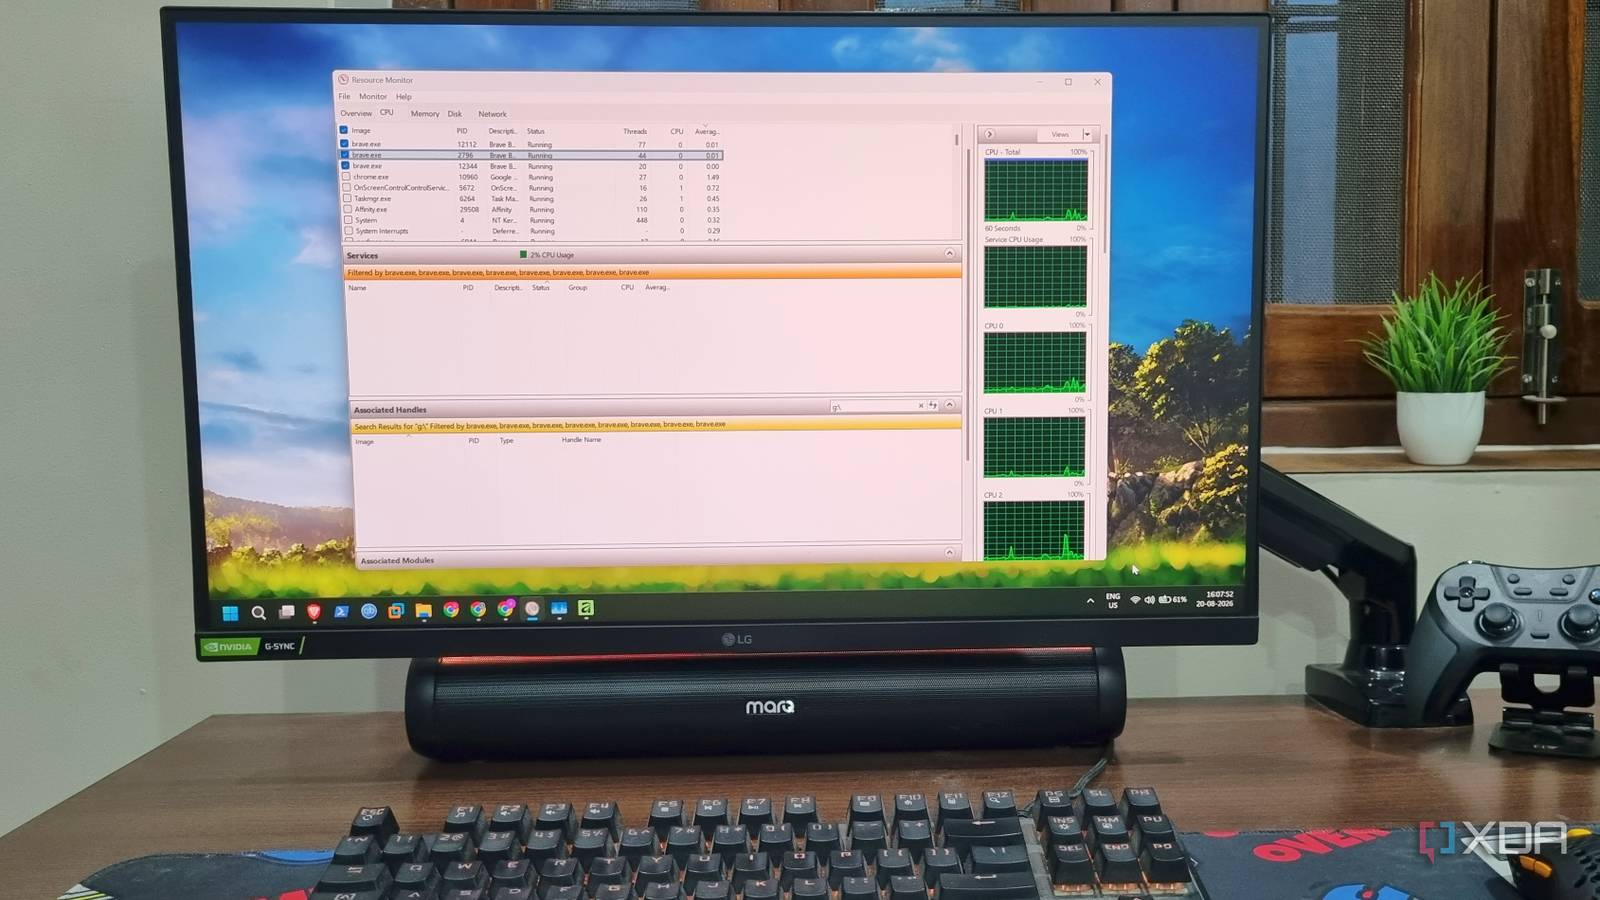
Published Aug 29, 2026, 11:00 AM EDT Abhishek is an author at XDA who covers computing. He has loved computers since he got the Lenovo G570 in 2012. Abhishek holds a master's degree in computer applications and began his writing career in 2018. He loves writing how-to articles, listicles, and informational posts on popular operating systems and web services. He closely follows the Windows Insider program and tests new Insider builds to discover upcoming experimental features and upgrades. His past work includes long-term collaborations with reputed publications like Tom's Hardware, and Windows Latest. When not writing anything, he is busy watching new episodes of One Piece or searching for something binge-worthy. Windows Task Manager is one of those OS utilities that I use daily. It’s become a habit to check memory usage, since I run virtual machines alongside Windows 11. The tool received a much-needed facelift in Windows 11 and now aligns with the UI and feels easy on the eyes. But Task Manager doesn't paint the complete picture of your resource consumption. There's one more, less popular yet useful Windows utility that can help you dive deep into system metrics. Resource Monitor has been a part of the OS since Windows Vista (an OS that received too much hate), but you might not have used it at all. However, it's an incredibly powerful tool that can help you uncover metrics and discover what a process is doing behind the scenes. Resource Monitor shows what Task Manager can't More details when you need them If you type resmon in the Start Menu now and launch it, you'll probably close it within a minute. The main reason is that Microsoft doesn't make Resource Monitor’s UI as approachable and convenient as Task Manager's. The latter is useful for most Windows users because it shows limited information. You want a process list; there's a dedicated tab for it. If you want to know about startup apps, there's a tab for that. There's even a Services tab to show all active services, plus a separate Performance section to monitor system hardware. Task Manager even supports theming and encapsulates all the information in a digestible format with an appealing UI. But what happens when you want to know more about a process, or what activity is stressing your system storage? Task Manager can only help so much in these situations, and if you want to learn the root cause, Resource Monitor can help. It might not have the greatest interface, but it can divulge more information when Task Manager falls short. If you've ever taken a serious glance at the Task Manager's performance tab, you might have seen some confusing information. While the graphical representation looks nice, the reported stats can make your head spin. The top corner shows the installed memory capacity, while the committed section shows a higher number. On my PC, it shows 12.4 committed memory out of 24.4, which seems impossible on a 16GB memory configuration. Windows adds the size of the page file to the available total memory, bumping the number to something physically impossible. This is a small case of what’s confusing in the Task Manager. Similarly, you might see a spike in disk activity when an app is downloading something in the background or syncing files to a remote server, but you cannot view the details of the new files being written by that process. More granular metrics Task Manager tends to leave out a lot Resources Monitor has a great Overview section, which tells you about the four major system components in a cascading-style section. It’s often enough to find more details about an active process without viewing each tab separately. Once you click a process in the CPU tab and select the checkbox next to it, it populates information related to all three other components. For example, if I’m curious about a system process, selecting it shows that process's active memory usage, the IP addresses it’s communicating with, and the files involved in disk activity on your system. It shows the actual file path, the IP addresses, and the committed and active working memory set, all of which aren’t possible in Task Manager. If I want to know about a file that’s been slowly downloading in the background, even when I close Brave, Task Manager will report disk activity. I can still narrow it down to a Brave-related process using that disk space, but where it’s writing the file and what file it is will always remain a mystery. Task Manager can't do much beyond that, and even if you open the service's actual file location, it will just point to Brave's executable. The browser is a simple example of a tool, but it can also be something more sinister, like malware downloading huge files or using your CPU cores to run a heavy background process. In those cases, Task Manager stops being useful after a point, while Resource Monitor shows every granular detail. Task Manager is still useful Some features are sensible I don’t want to lambast Task Manager to a point where it feels useless. Microsoft made some genuine improvements, and it can now show individual logical processors' activity, categorize related processes in a drop-down list, and even include a search function to help you find processes more easily. For general use, it's a great starting point before jumping straight to Resource Monitor. Task Manager is intentionally a basic tool, limited to quick process identification, startup app management, and graphical summaries. It still cannot find hard fault incidents in memory, pinpoint each process’s network connection information, or the associated handles (files or OS components). For these tasks, you have to use Resource Monitor or more powerful tools like Process Explorer. Resource Monitor needs a facelift Old Windows utilities rarely get the care they deserve, and Resource Monitor is a prime example of a tool stuck in the past. The UI alone can deter many users, and the lack of process grouping and search features makes troubleshooting a bit harder. But it remains one of the best native tools for finding more details about a process, locating the associated handles behind it, and learning more about it. You might not use it daily, yet knowing your way around it and what the metrics mean can be immensely helpful while troubleshooting your PC. Windows 11 Pro
I stopped trusting Task Manager after discovering what Resource Monitor reveals
Full Article
Original Source
Read the full article at Xda-developers →KhanList aggregates and links to publicly available news content. We do not host full articles from third-party sources. Always verify important information with original sources.