
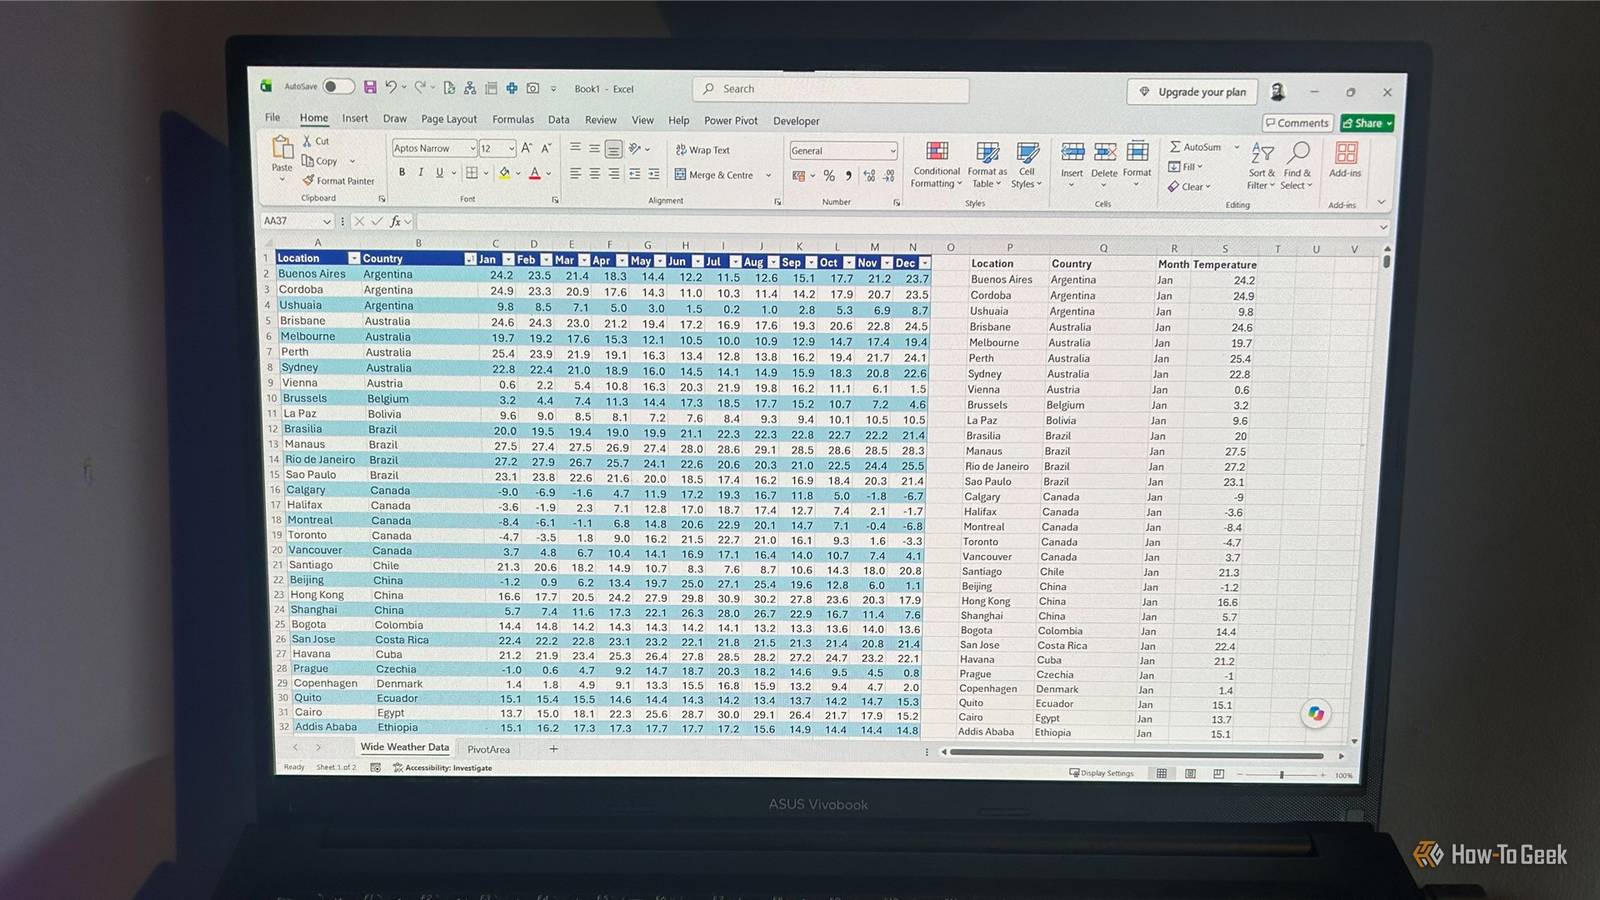
Published Sep 20, 2026, 7:00 AM EDT Tony Phillips is an experienced Microsoft Office user with a dual-honors degree in Linguistics and Hispanic Studies. Prior to starting with How-to Geek in January 2024, he worked as a document producer, data manager, and content creator for over ten years, and loves making spreadsheets and documents in his spare time. Tony is also an academic proofreader, experienced in reading, editing, and formatting over 3 million words of personal statements, resumes, reference letters, research proposals, and dissertations. Before joining How-To Geek, Tony formatted and wrote documents for legal firms, including contracts, Wills, and Powers of Attorney. Tony is obsessed with Microsoft Office! He will find any reason to create a spreadsheet, exploring ways to add complex formulas and discover new ways to make data tick. He also takes pride in producing Word documents that look the part. He has worked as a data manager in a secondary school in the UK and has years of experience in the classroom with Microsoft PowerPoint. He loves to encounter problems in Microsoft Office and use his expertise and legal-level training to find solutions. Outside of the Microsoft world, Tony is a keen dog owner and lover, football fan, astrophotographer, gardener, and golfer. I'm one of those people who really cares about how datasets are laid out in Excel. That's partly because I'm a bit obsessive, but it's mainly because getting the structure right makes my life much easier down the line. I've lost count of how many times I've had to reshape an imported or received dataset, but Excel for Microsoft 365 gives me a surprisingly easy way to do it. I'll be open from the start: this involves Python. But before you decide it's not for you, hear me out. Python isn't just for programmers, and I'll give you everything you need to use it in Excel. Once you've tried it once, the learning curve isn't nearly as steep as you might think. My Excel data looked fine—until I tried to analyze it Readable doesn't mean usable Take this weather dataset as an example. It contains 100 locations, their countries, and their average temperatures for each month of the year. At first glance, there's nothing wrong with it. In fact, this layout is probably what many people would choose if they wanted to read the data on screen. The problem starts when I want to use Excel tools to analyze the data. At the moment, the months are spread across 12 separate columns, rather than being a single field I can use in my analysis. This is an example of wide data. For many types of analysis, I find long data much more useful, where each column represents a field and each row represents a record. So in this example, there'd be a column for the location, another for the country, another for the month, and a final one for the temperature. The locations would appear once for January, again for February, and so on throughout the year: Location Country Month Temperature Buenos Aires Argentina Jan 24.2 Cordoba Argentina Jan 24.9 ... ... ... ... Buenos Aires Argentina Feb 23.5 Cordoba Argentina Feb 23.3 One Python formula reshapes the whole dataset Two lines do the heavy lifting The good news is that I don't need a Python program to do this. The transformation is just two lines of Python code directly in Excel, and I'm going to save the formula because I know I'll want it again the next time somebody sends me a spreadsheet in the wrong shape. This process is often called unpivoting. If you've used Power Query, you may already know the term, as it has an Unpivot Columns command that performs essentially the same job. I could use that here, but Python lets me turn the transformation into a formula that sits alongside my data. Make sure your source data is formatted as an Excel table (Ctrl+T) with an easily recognizable table name before you start. Tables expand automatically when you add new rows, which is useful when you want the Python result to pick up new data later. To start, select a cell and either go to Formulas > Insert Python or type =PY( into the cell. Excel then switches to its Python editor, where you can enter the following two lines: df = xl("WeatherData[#All]", headers=True) df.melt(id_vars=["Location", "Country"], var_name="Month", value_name="Temperature") The first line reads my Excel table into Python: df = xl("WeatherData[#All]", headers=True) WeatherData is the name of my table, [#All] references the whole table, and headers=True tells Python that the first row contains my column headings. The second line does the reshaping: df.melt(id_vars=["Location", "Country"], var_name="Month", value_name="Temperature") I'm telling melt() to leave Location and Country alone. It then takes the remaining columns and turns their headings into a new Month column and their contents into a new Temperature column. The useful part is that I don't have to list Jan, Feb, Mar, and all the other columns individually. Because I've specified the columns I want to keep, melt() handles the rest automatically. Before I press Ctrl+Enter to commit the formula, I change the Python Output to Excel Value. This puts the reshaped DataFrame directly into the worksheet, where I can use it with PivotTables, charts, formulas, and other Excel features. The result is a much more useful dataset, with 1,200 rows for my 100 locations and 12 months. Notice how Buenos Aires now appears once for each month. Reuse the formula with your own wide data Simply swap a couple of details The nice thing about this formula is that you don't need to understand Python to adapt it. You only need to change a few pieces: Part of the formula Replace it with WeatherData The name of your own Excel table Location A column you want to keep unchanged Country Another column you want to keep unchanged Month The name you want for the new column containing your original column headings Temperature The name you want for the new column containing the corresponding values The last two names are entirely up to you. They're the two new columns created by melt(): one contains the original column headings, and the other contains their corresponding values. You can have as many columns as you need in id_vars, as long as you list their names. For example, suppose I had a sales table called SalesData with Product, Department, Q1, Q2, Q3, and Q4 columns. I could adapt the formula like this: df = xl("SalesData[#All]", headers=True) df.melt(id_vars=["Product", "Department"], var_name="Quarter", value_name="Sales") The same two lines now turn my four quarterly columns into a Quarter field and a Sales field. Now analysis actually works And everything updates when my source data changes Once the weather data is in long format, I can use it with the Excel tools I already know. For example, I can use a PivotTable to see which countries have the highest average temperatures for a particular month, then turn the results into a PivotChart for visual comparison. I've also made the PivotTable source dynamic by using the spilled range from my Python formula. Instead of giving Excel a fixed range, I used the # spill range operator after the cell containing my formula: 'Wide Weather Data'!$P$1# This becomes useful when my source data changes. If I add another location to my WeatherData table, the table expands, my Python formula picks up the new row, and the spilled result grows accordingly. I still need to refresh the PivotTable before it picks up the new data, but once I do, the new location appears without me having to redefine the PivotTable's source range. I haven't become a Python programmer I'm still no Python programmer. But I do have a little piece of Python code saved now, ready for the next time someone sends me a spreadsheet in the wrong shape. That's the thing I like about Python in Excel: I don't have to replace the Excel tools I already know. I can use Python for the awkward bit, then bring the reshaped data back into my Excel workflow and carry on as normal.
I fixed my messy Excel dataset with a single formula
Full Article
Original Source
Read the full article at Howtogeek →KhanList aggregates and links to publicly available news content. We do not host full articles from third-party sources. Always verify important information with original sources.