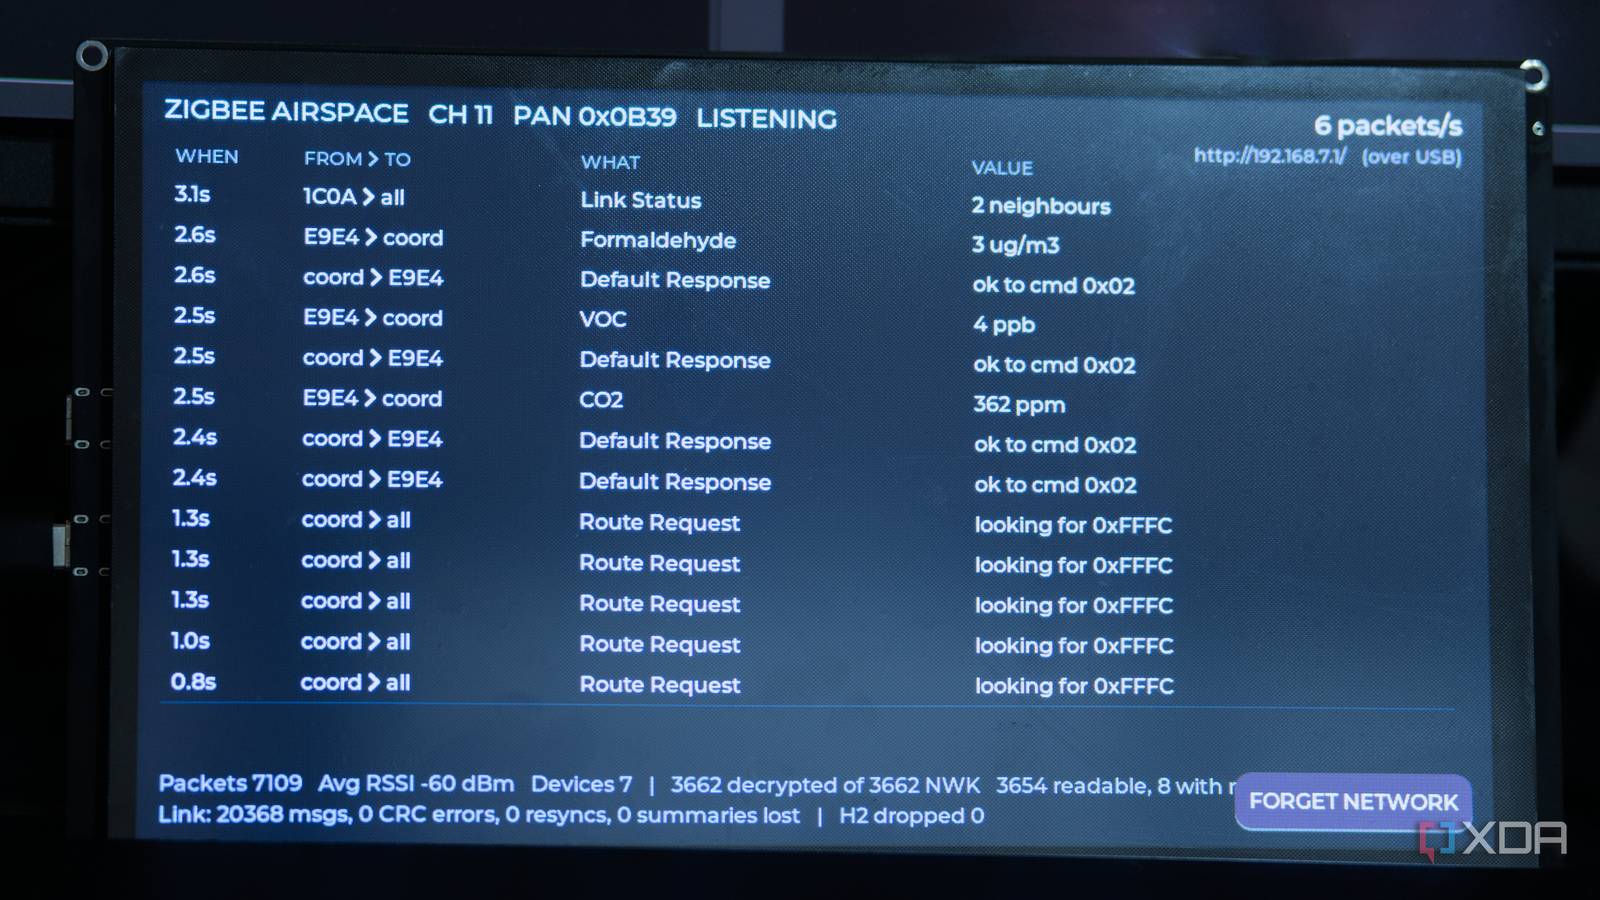
Published Aug 18, 2026, 3:30 PM EDT I’m Adam Conway, an Irish technology fanatic with a BSc in Computer Science and I'm XDA’s Lead Technical Editor. My Bachelor’s thesis was conducted on the viability of benchmarking the non-functional elements of Android apps and smartphones such as performance, and I’ve been working in the tech industry in some way or another since 2017. In my spare time, you’ll probably find me playing Counter-Strike or VALORANT, and you can reach out to me at adam@xda-developers.com, on Twitter as @AdamConwayIE, on Instagram as AdamConwayIE, or u/AdamConwayIE on Reddit. Sign in to your XDA account If you have a Zigbee smart home network, the main way to see what's happening on it is through your coordinator's logs, but you don't see the actual network at work. Zigbee2MQTT gives you a scrolling list of messages, Home Assistant can show you the important ones, and if something goes wrong, you dig through serial output or set up a packet capture. It may work, but it's not exactly something you can glance at from across the room, and it never looks like normal traffic. I wanted a screen that shows me the live conversation; every time a sensor reports, a switch toggles, or a router forwards a packet, I wanted to see it. I ended up building one, using the Elecrow CrowPanel Advance 10.1-inch ESP32-P4 display with the ESP32-H2 wireless module, and it sniffs Zigbee traffic and shows it on its own screen, no WireShark required. Even better, the panel is $60, and the ESP-32-H2 module is $4.90. The screen shows what it hears in real time, with frames appearing as they're decoded and showing where they came from, which cluster they hit, and the value they carried. Frames it couldn't read are flagged as encrypted rather than guessed and decoded incorrectly, and it keeps a device table and a capture health view as well. If I want to see the raw bytes, I can either tap a row and get the hex dump or look in the web viewer. It's not a replacement for Wireshark when you need deep protocol analysis, but for seeing your network be a network, it does something a packet capture doesn't. This only works on a network you control; I connect the ESP32-H2 to my Zigbee network to start with, as a normal device, so that it can be granted the network key. Without that key it can still see each of the frames, but it has no way to decrypt and read them. This is a tool for looking inside your own Zigbee network, not someone else's. About this article: Elecrow sent me the CrowPanel Advance display and the ESP32-H2 module for testing purposes. The company had no input into this article. The ESP32-P4 doesn't have Wi-Fi, and the H2 isn't plug-and-play Getting two chips to talk to each other The CrowPanel Advance 10.1-inch is built around the ESP32-P4, Espressif's higher-end RISC-V chip, and Elecrow paired it with 32MB of PSRAM and 16MB of flash. As well, it has a MIPI-DSI display interface and H.264 encoding on the chip itself, alongside an ESP32-C6 for connectivity. The ESP32-P4 has no Wi-Fi or Bluetooth at all, and this configuration is a fairly common way to get around that using Espressif's ESP-Hosted component. There's also a socket for a replaceable wireless module, which is where the ESP32-H2 goes. The ESP32-H2 is Espressif's 802.15.4 chip with native Zigbee and Thread support, which pairs nicely with the ESP32-P4 handling the display and the web server. This means building two firmwares for two different chips, with a serial link between them. The ESP32-P4 side is pretty easy thanks to Elecrow's documentation, but the H2 side was not. Elecrow's datasheet labels the socket's pads U1TXD and U1RXD but never says which of the module's GPIOs are behind them, and the H2's UART1 has no default pin assignment at all; it's routed entirely through the GPIO matrix, so there's nothing to infer from. Meaning you have to measure it. To do this, I wrote a pin-sweep mode into the H2 firmware, and it uses the UART1's transmit line to test each candidate GPIO in turn, and the P4 then outputs whatever arrives. Whichever GPIO number turns up in the text is the one wired to the socket's pad, and this worked to figure out the connectivity side of things. The ESP32-H2's datasheet accounts for most of its pins, leaving only a handful of genuine unknowns. It turned out that GPIO24 was U1TXD, with GPIO23 being U1RXD. In hindsight, given that these are the module's default console UART pins, I probably should have just... tried those first, but hey, it works now. The other complication was the ESP32-C6 used for connectivity. I've used other CrowPanel devices with this same pairing, and it worked once I figured out the one-bit bus configuration. Unfortunately, in this instance, I just couldn't get it to work. The SDIO connection dropped immediately, in the same way as those other boards, with nothing I could do fixing it. It's a relatively common problem I've come across with many different manufacturers, not just Elecrow, but it made this project harder than it needed to be as a result. It's a shame, too, because an ESP32-P4 running the display, an ESP32-C6 doing Wi-Fi, and an ESP32-H2 for Zigbee would have been three different ESP32 chips working in tandem on one board; bit of a Frankenstein situation, really. All of this means that the web panel couldn't run over Wi-Fi, so I ran it over USB instead. The ESP32-P4 can act as a USB Ethernet device and run its own DHCP server, allowing me to plug in a computer or my laptop to the USB 2.0 port and get an address on its internal DHCP. Once I navigate to 192.168.7.1, I can see the entire web panel, but the trade-off with this approach is that I can't access it over my network. For a desk device it's not a huge loss, but it's still annoying. How the sniffer actually works Join once, capture forever, and never trust a decrypt that didn't verify The ESP32-H2 runs ZBOSS for its Zigbee stack, how it works is pretty simple. On first boot, I join the network, put my Zigbee coordinator in pairing mode, and the H2 scans all channels until something responds. Once connected, it captures the network parameters and the network key, writes them to NVS, sets its boot mode to sniff, and restarts itself. From then on, the H2 boots directly into promiscuous 802.15.4 capture on the saved channel, never participating in the network again. I spent a lot of time building this, because Espressif does document a way to sniff Zigbee networks... but it isn't this way. At all. Espressif's guidance on this involves flashing the ESP32-H2 with ot_rcp, which is an OpenThread radio co-processor firmware, controlling it from a host running Pyspinel, and using Wireshark with the network key for trawling through packets. In that configuration, the chip is a dumb radio and all the decoding happens elsewhere. It's simple, but it's not going to work for a device on a desk that you want running autonomously. Instead, I do the decrypt and parse stages on the ESP32-H2 itself. The method I've used here is essentially undocumented; it uses the Espressif's promiscuous-mode API, which is open source and actively maintained, but it has no documentation page anywhere. The only documentation for esp_ieee802154_set_promiscuous() that I could find was its own header file. Funnily enough, I did also find migration notes for it, meaning Espressif is happy to tell you what changed... in the thing they never told you even existed. Decryption is handled using the stored network key through mbedtls, and an incorrect key, corrupted frame, or misbuilt nonce all fail appropriately and show as encrypted. The biggest snag I hit was Zigbee's handling of the security-level bits in the auxiliary header. They're transmitted as zero in the frames I was receiving, even though Zigbee network security uses level 5, meaning encryption with a 32-bit MIC. For decryption, I therefore had to restore those bits to 5 before constructing the security-control byte used in the CCM* nonce. Frames that do decrypt get parsed through NWK, APS, and ZCL layers, and each frame has a decoded reading on screen: source, destination, cluster, command, and value. I have some Tuya devices, which is also how I learned that I needed separate handling as it uses a completely different datapoint model from ZCL attributes. The H2 streams a structured summary to the P4 for every frame it captures, and the P4 stores them in a PSRAM ring buffer, coming to about 5MB for 16,384 frames. When full, the oldest frames are overwritten. What the web panel shows Feed, devices, and health are all the views I need The web panel has even more information, hosting three separate views that I can click through. Starting with a scrolling table of every decoded frame, each row shows when it happened, the source and destination addresses, the cluster it hit, and the value. The coordinator (at address 0x0000) has a dotted underline so that it stands out, and I mark broadcasts and show truncated frames with an amber badge. If I click a row, I get the full details with the decoded reading, the layer chain, and the raw hex dump alongside the corresponding ASCII. In the devices view, I aggregate by short addresses, and each row shows how many packets the device sent and received, its average RSSI, the last cluster it transmitted on, and a profile selector for Tuya datapoints. In the Tuya column, I can pick the right datapoint profile for a device, and if the device reports its manufacturer name during a Basic-cluster read, I set the profile automatically. From what I could gather in looking at Zigbee2MQTT's documentation, mostly only do that when they join, and I've had to pick all of them by hand so far. Capture health is useful too, especially when I first built it. I added it at first as I wasn't sure if the ESP32-H2 could even keep up with it, as it only has 320KB of RAM and a single serial out, so it splits into what it heard and what could actually be read. If any of the drop counters move up, it gets flagged, and I can see if it's actually keeping up or not. It's not exactly a pixel-perfect Wireshark clone, but I also don't want it to be. There are quite a few rough edges here, but it's still pretty fun to see my network talking to itself. You can see polls, reports, retries, and you can also see if a sensor several rooms away is still even reporting. It turns something that's inherently invisible into something visible, and it was a fun way to learn how to connect these two chips together as well.
I built a Zigbee sniffer on a $60 ESP32 screen, and now I can watch my smart home talk to itself
Full Article
Original Source
Read the full article at Xda-developers →KhanList aggregates and links to publicly available news content. We do not host full articles from third-party sources. Always verify important information with original sources.