
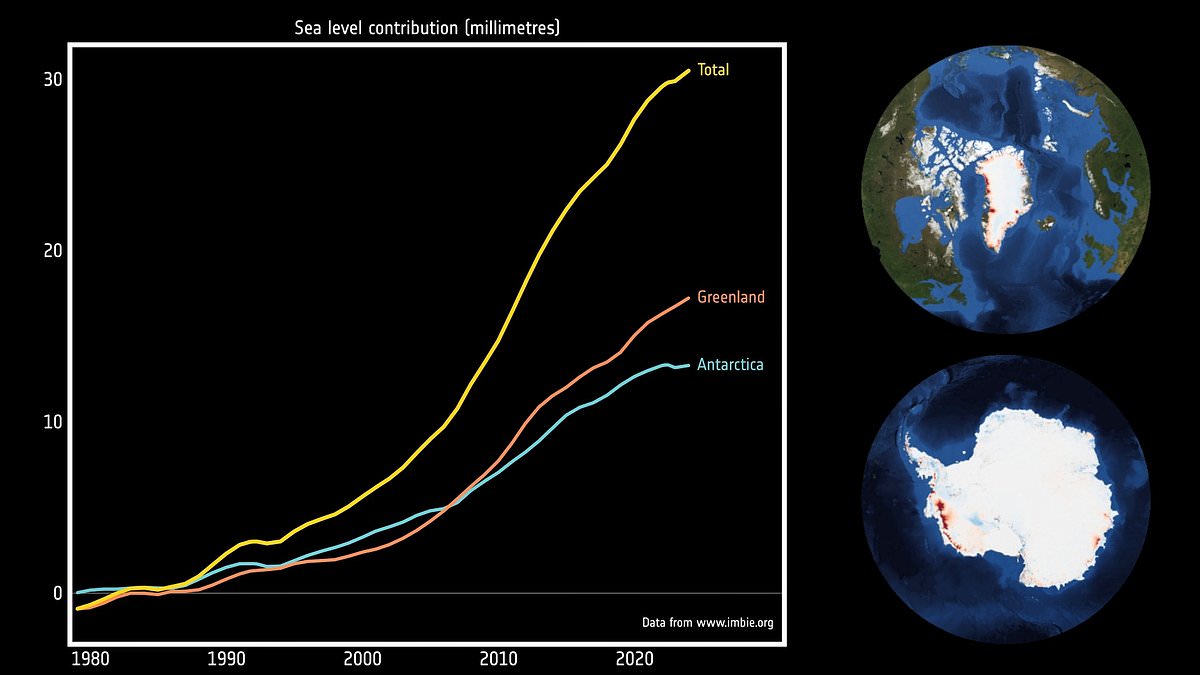
Greenland and Antarctica have lost 11.3 trillion tonnes of ice over the last 50 years, raising global sea levels by more than 1.1 inches (3cm), a new study reveals.An international team of polar scientists has produced the most complete picture of ice loss from the two largest ice sheets in the world.The findings show that melting ice in Greenland has driven sea levels up by 0.7 inches (1.8cm) while Antarctica has contributed 0.5 inches (1.3cm) since 1976.Overall, 84 per cent of the combined loss was driven by glaciers speeding up and pouring more ice into the ocean, with just 16 per cent due to surface melting.Scientists have warned the sea level rise has put millions more people at risk of coastal erosion and flooding – and this could continue to get worse thanks to climate change.Lead author Dr Inès Otosaka, from Northumbria University, said: 'By reaching back to the 1970s, we can now see how the ice sheets have changed across half a century.'More than four–fifths of the ice lost was discharged into the ocean by faster–flowing glaciers, rather than melted at the surface – which tells us the long–term trend is being driven by the dynamic response of the ice sheets to a warming ocean.' Greenland and Antarctica have lost 11.3 trillion tonnes of ice over the last 50 years, raising global sea levels by more than 1.1 inches (3cm) The findings show that melting ice in Greenland (pictured) has driven sea levels up by 0.7 inches (1.8cm)For the study, the researchers combined 42 independent satellite surveys, drawing on 27 satellite missions which date back to the 1970s.Overall, Greenland and Antarctica lost 11,309 billion tonnes of ice between 1979 and 2023 – with losses climbing steeply in recent decades.Greenland saw its rate of loss rise from around 60 billion tonnes a year in the 1980s to 264 billion in the 2010s, a decade marked by repeated extreme summer melt events.Antarctica's rate rose from around 48 billion tonnes a year in the 1980s to 202 billion in the 2010s, with all of its loss caused by ocean melting of its outlet glaciers.The study found the most recent years, 2020–2023, brought a temporary slowdown in ice loss.Record snowfall over East Antarctica helped to offset some of the continent's glacier losses elsewhere, while a run of milder Greenland summers roughly halved its surface melting.However, the scientists warn these are short–term fluctuations against a clear long–term trend – and are not a reversal of ice loss.Professor Andrew Shepherd, who also led the study, said: 'Three centimetres of sea level rise may sound small, but that puts another six to nine million people at risk of coastal flooding and erosion. With the ice sheets set to lose much more ice in the decades ahead, global assessments like [this] are vital to protecting communities impacted by climate change.' Scientists have warned the sea level rise has put millions more people at risk of coastal erosion and flooding – and this could continue to get worse thanks to climate change The rate of ice loss rose in Antarctica (pictured) from from around 48 billion tonnes a year in the 1980s to 202 billion in the 2010sThe findings, published in the journal Scientific Data, also underline the ice sheets' central role in future sea level rise, the researchers said, as their response to a warming climate is the single largest source of uncertainty in sea level projections.Globally, the average sea level has risen by 0.14in (3.64 millimetres) per year since 1999, for a total of 3.6in (9.38cm) over the last 26 years.About 30 per cent of that increase comes from the ocean expanding as it warms, while the remaining 70 per cent mainly comes from melting glaciers and ice sheets.While this trend has been relatively stable for decades, recent satellite data shows that this increase rapidly accelerated after 2012, jumping to 4.1mm per year.Dr Diego Fernández, Head of the Science Section at ESA, said: 'These findings show the fundamental importance of using satellites to monitor the ice sheets and to evaluate the models used to predict the effects of climate change. 'Sustaining missions such as CryoSat–2 and the Sentinels, and maintaining the long–term ice–sheet climate data record, is critical for the decades ahead.'A separate study warned that rising sea levels could plunge 1.7 million Brits' homes underwater by 2300 and render parts of the UK uninhabitable.Researchers from the Met Office and the University of Bristol used computer models to see how many people will be at risk of coastal flooding by future climate change.They found areas such as the Wash and the Humber Estuary stood out as 'hot spots' for future coastal flooding.A large part of the Southeast, Norfolk, and the northwest coastline will also be plunged underwater, with extensive flooding likely around Blackpool and Liverpool from the River Mersey.Densely populated major cities will also bear the brunt of the flooding, as a significant chunk of west London is submerged by rising sea levels.Co–author Professor Jeffrey Neal, Professor of Hydrology at the University of Bristol, said: 'The worst–case sea–level rise outcomes would pose massive challenges for the UK in the coming centuries and the need for large–scale movement of populations and settlements away from the coast.' GLACIERS AND ICE SHEETS MELTING WOULD HAVE A 'DRAMATIC IMPACT' ON GLOBAL SEA LEVELSGlobal sea levels could rise as much as 10ft (3 metres) if the Thwaites Glacier in West Antarctica collapses. Sea level rises threaten cities from Shanghai to London, to low-lying swathes of Florida or Bangladesh, and to entire nations such as the Maldives. In the UK, for instance, a rise of 6.7ft (2 metres) or more may cause areas such as Hull, Peterborough, Portsmouth and parts of east London and the Thames Estuary at risk of becoming submerged.The collapse of the glacier, which could begin with decades, could also submerge major cities such as New York and Sydney.Parts of New Orleans, Houston and Miami in the south on the US would also be particularly hard hit.A 2014 study looked by the union of concerned scientists looked at 52 sea level indicators in communities across the US.It found tidal flooding will dramatically increase in many East and Gulf Coast locations, based on a conservative estimate of predicted sea level increases based on current data.The results showed that most of these communities will experience a steep increase in the number and severity of tidal flooding events over the coming decades.By 2030, more than half of the 52 communities studied are projected to experience, on average, at least 24 tidal floods per year in exposed areas, assuming moderate sea level rise projections. Twenty of these communities could see a tripling or more in tidal flooding events.The mid-Atlantic coast is expected to see some of the greatest increases in flood frequency. Places such as Annapolis, Maryland and Washington, DC can expect more than 150 tidal floods a year, and several locations in New Jersey could see 80 tidal floods or more.In the UK, a two metre (6.5 ft) rise by 2040 would see large parts of Kent almost completely submerged, according to the results of a paper published in Proceedings of the National Academy of Science in November 2016.Areas on the south coast like Portsmouth, as well as Cambridge and Peterborough would also be heavily affected.Cities and towns around the Humber estuary, such as Hull, Scunthorpe and Grimsby would also experience intense flooding.
Greenland and Antarctica have lost 11.3 trillion tonnes of ice since the 1970s - raising global sea levels by more than 1.1 inches, study finds
Full Article
Original Source
Read the full article at Dailymail →KhanList aggregates and links to publicly available news content. We do not host full articles from third-party sources. Always verify important information with original sources.