
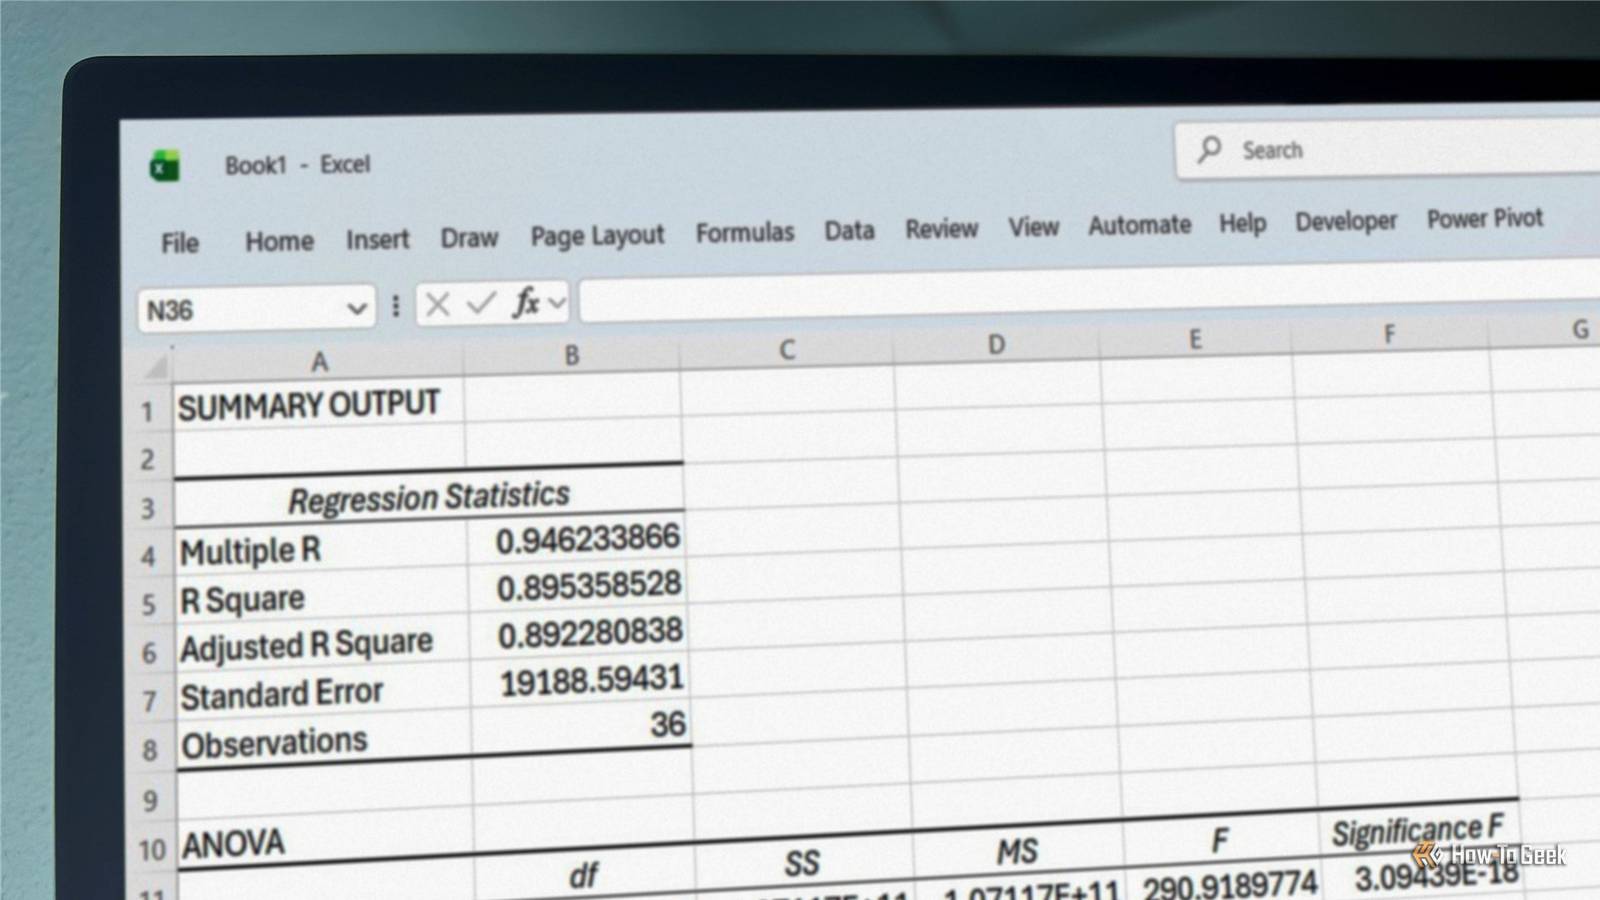
Published Nov 11, 2026, 7:00 AM EST Tony Phillips is a senior author at How-To Geek with over a decade of experience working with documents, data, and digital productivity tools. Holding a dual-honors degree in Linguistics and Hispanic Studies, he combines technical expertise with a passion for making complex topics easy to understand. Before joining How-To Geek in 2024, Tony worked as a document producer, data manager, legal document specialist, and content creator. He has also proofread and edited more than 3 million words of academic and professional writing. While Tony specializes in Microsoft 365, particularly Excel, his interests extend far beyond Office. He enjoys testing software, exploring open-source projects, discovering useful companion apps, and finding ways to customize and optimize Windows. Whether he's building spreadsheets, evaluating new tools, or uncovering hidden features, Tony enjoys helping readers get more from their technology. Outside of tech, he enjoys spending time with his dog, watching football, astrophotography, gardening, and golf. Analysis ToolPak is one of those Excel features I'd mentally filed under "I'll look at that one day." I'd seen it mentioned in tutorials, knew roughly what it did, and knew where to enable it if I ever needed it. The problem was that I never felt like I needed it. When I wanted to understand a dataset, I'd usually reach for formulas, Power Query, or lately, AI. Yet within a few minutes of revisiting Analysis ToolPak, I had a workbook full of descriptive statistics, correlations, regression models, and histograms. More importantly, I hadn't written a formula or a prompt to get there. It didn't make me stop using AI, but it did remind me of something I'd forgotten: before asking a chatbot to analyze my spreadsheet, it's worth checking whether Excel can do the job itself. You'll need to enable it first Think of Analysis ToolPak as a toolbox full of ready-made insights. Instead of building formulas from scratch, you can point Excel at a dataset and quickly generate reports that help explain what's happening behind the numbers. If you don't already see a Data Analysis button on Excel's Data tab, go to File > Options > Add-ins. At the bottom of the window, select Excel Add-ins from the Manage drop-down menu, click Go, and enable Analysis ToolPak. Once you've done that, you'll find the Data Analysis button on the right-hand side of the Data tab. To see whether I'd been overlooking something useful all these years, I put together a fictional dataset covering 36 months of activity for a small online retailer and tested four of Analysis ToolPak's most popular analytical tools. Get a statistical summary in one click Descriptive Statistics gave me a useful starting point The most important number in a spreadsheet like this is often the revenue, so that's where I began. More specifically, I wanted to know what a "normal" month actually looked like. I ran Analysis ToolPak's Descriptive Statistics report against the Revenue column. In a few clicks, Excel generated everything from the mean and median to the standard deviation, range, minimum, and maximum. The first thing that caught my attention was the difference between the mean and median. Average monthly revenue was roughly $177,000, while the median was closer to $159,000. Combined with a standard deviation of around $58,000, that suggested monthly revenue varied considerably and that a relatively small number of especially strong months were pulling the average upward. In other words, a "typical" month wasn't quite as successful as the average alone made it appear. What I liked most was how quickly that report turned a table of numbers into a set of questions worth investigating. Explore relationships in your data Correlation revealed a very strong connection The descriptive statistics told me what was happening. Next, I wanted to know why. Marketing expenditure seemed like an obvious place to start. I ran Analysis ToolPak's Correlation tool on the marketing-spend and revenue columns. The result was a correlation coefficient of about 0.946, indicating a very strong positive relationship between marketing spend and revenue. In practical terms, months with higher marketing spend generally coincided with higher revenue. As always, correlation doesn't prove causation, and other factors could be influencing both figures. Still, it had done its job. A hunch had turned into something worth exploring further. See how strongly two variables are linked Regression produced the most interesting result Naturally, the next question was how strong that relationship actually was. To investigate further, I ran ToolPak's Regression report. The figure that immediately caught my attention was R², which came out at approximately 0.895. In plain English, the model explained nearly 90% of the variation in revenue in this dataset. That's a pretty strong relationship. It doesn't mean marketing spend is solely responsible for revenue, nor does it mean the model can predict future results with perfect accuracy. But it did suggest that marketing expenditure was closely associated with revenue throughout the three-year period. What impressed me most was how fast Excel got me there. This was also the point where I started thinking differently about AI. I'd rather let Excel generate the model and handle the calculations, then use AI to explain what the results mean, point out limitations, or suggest what I should investigate next. Visualize patterns that raw numbers can hide Histogram showed the distribution at a glance What I still couldn't see was how frequently different revenue levels occurred. That's where the Histogram tool came in. Rather than calculating another statistic, it grouped the revenue values into ranges and showed how many months fell into each one. The resulting chart made something immediately obvious: most months clustered within the lower and middle revenue bands, while a smaller number of particularly successful months occupied the upper ranges. In other words, the descriptive statistics had been telling the truth all along. A handful of unusually strong months were helping pull the average upward. What I liked about the histogram was that it made the observation visible. The mean and median had hinted that the data wasn't evenly distributed. The chart made that difference much easier to see. AI still has an important role to play Not every analysis needs the same workflow If I wanted a report that updated automatically as new data arrived, I'd probably ask AI to help build a formula-driven solution instead. It's good at that. It can suggest formulas, explain how they work, and help keep the analysis connected to the underlying data. For this exercise, though, I actually preferred Analysis ToolPak's static outputs. If I add another month's figures, I need to rerun the analysis rather than watching the results update automatically. I came to see that as a benefit. If I'm comparing year-end results, documenting a particular analysis, or comparing future performance with a specific point in time, having a fixed record of the output can be useful, especially when I keep the underlying data alongside it. Once I've generated those reports, AI becomes much more useful. I can ask it to explain the R-squared value, identify limitations in the analysis, suggest follow-up questions, or turn the results into a presentation-ready summary. For example, after generating the regression report, I asked Copilot what I should investigate next. Rather than simply repeating the statistics back to me, it suggested checking for seasonality, testing the model against future data, and looking for other factors that might be influencing revenue. That's a much more useful division of labor than expecting a chatbot to do everything. Excel generates the analysis. AI helps me understand it, communicate it, and decide what to investigate next. Excel might already have the answer After spending some time with Analysis ToolPak, I was surprised by how quickly it helped me understand a dataset and identify questions worth investigating further. Before exporting your data, uploading a workbook, or opening a chatbot, take a look at Excel's Data Analysis button. You might already have the tool you need. If you'd rather start with Excel's AI-assisted approach instead, its Analyze Data tool takes the process in a very different direction.
Before you ask AI to analyze your spreadsheet, try Excel's forgotten Analysis ToolPak
Full Article
Original Source
Read the full article at Howtogeek →KhanList aggregates and links to publicly available news content. We do not host full articles from third-party sources. Always verify important information with original sources.