
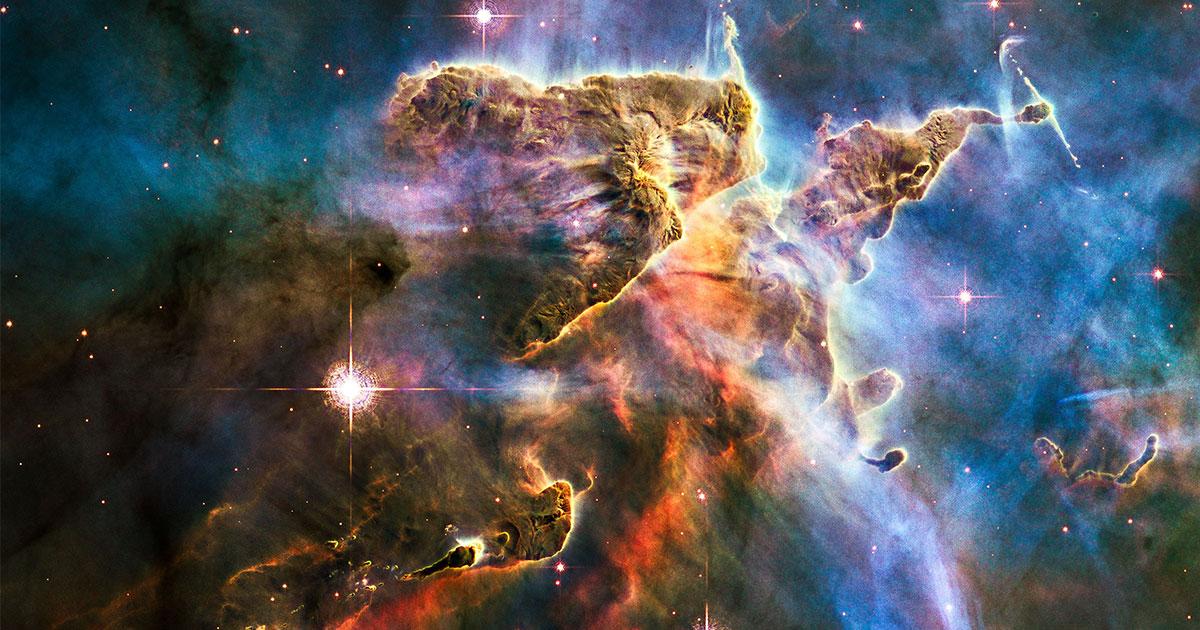
For decades, astronomers treated the interstellar medium as a static backdrop to the goings-on of the universe. Now, a wave of 3D mapping is bringing the interstellar medium’s dynamic nature into focus. In 2010, the Hubble Space Telescope released this image of a pillar of gas and dust in the Carina nebula that’s about 3 light-years — roughly 18 trillion miles — tall. NASA Introduction You might imagine space to be empty. But the seeming void contains a barely perceptible fog of hydrogen and other neutral atoms. In 2020, NASA’s New Horizons spacecraft, having passed the orbit of Pluto, measured a proxy for the amount of hydrogen around it. In the area between stars in our galaxy — the “interstellar medium,” or ISM — New Horizons found around 130 hydrogen atoms per liter of space. This hydrogen, along with some helium and other molecules, is mostly left over from the Big Bang, and it’s constantly supplemented by infusions from cosmic phenomena such as stars ejecting jets of gas and dust as they are born and shedding their outer layers as they die. Because the ISM is so diffuse and changes so slowly, astronomers have largely ignored its details for the last half-century, treating it as a stationary backdrop to the flashier happenings of the universe. But mostly empty space is less simple than it seems. Over the past few years, astrophysicists have transformed our understanding of the interstellar medium. Using newly developed maps stretching thousands of light-years across our galaxy, they’ve discovered that it’s not the quiet, steady backdrop that researchers thought. Instead, much of the ISM appears to be unstable — a finding that directly contradicts the leading theoretical models taught in textbooks. The surprise finding could help resolve a long-unanswered question about how quickly stars form. Hot and Cold In 1969, the researchers George Field, Donald Goldsmith, and Harm Habing came up with a model of how the ISM behaves. They predicted that it exists in two stable states: cold and warm. As gas and dust float through space, they pull more gas and dust together through gravity, eventually forming a cloud. These clouds tend to cool down, because fast-moving molecules will collide with other molecules and lose energy. Their temperature stays at a bitter 100 kelvins, or about minus 173 degrees Celsius. Young stars, which appear red in this 2022 image from the James Webb Space Telescope, form within enormous spires of gas and dust called the Pillars of Creation. NASA But sometimes the gas and dust are too hot to collapse into a cold cloud; instead, they form a diffuse one. A diffuse cloud is much more exposed to nearby stars, which deliver new energy in the form of ultraviolet radiation. This process keeps the cloud at a steady temperature near 8,000 kelvins. Scientists thought that atoms in the interstellar medium would transition to either the cold or warm state almost instantly, leaving basically no unstable, intermediate ISM behind. In 1977, Chris McKee and Jeremiah Ostriker added a third phase to the picture: At supernova shock fronts, gas could get even hotter, transforming into a scorching plasma at a temperature of half a million kelvins. Yet even in this expanded framework, the atomic gas outside blast zones was assumed to achieve a calm, pressure-balanced existence. But it was hard to test the theory. Cold atomic hydrogen emits no visible light. The easiest way to measure it is to look for a rare atomic shift: The electron and proton inside a hydrogen atom will sometimes switch between two possible states. This transition emits a faint radio wave at a wavelength of 21 centimeters. For more than 70 years, astronomers have pointed radio dishes at the sky to detect these whispers of gas, but looking out along a single line of sight from Earth, they can only collect a tangled pile of signals from overlapping clouds. Sorting through the results is like looking through a stack of semitransparent colored plastic sheets; their colors blend together, making it difficult to identify any individual layer. Only in recent years, with the launch of new space telescopes, have astronomers been able to probe the space between stars in enough detail to pull these layers apart. The Gift of Gaia The Gaia telescope, launched in 2013, created new opportunities to understand the ISM by giving scientists access to a 3D map of the stars around our sun. You can see one method it used to make this map by holding your thumb in front of your face and closing your left eye, then your right. If you switch back and forth, you’ll notice that your thumb seems to move relative to whatever is behind it. The closer your thumb is to your face, the more your view of it will change. This phenomenon is called parallax. Scientists test Gaia’s deployable sunshield during the spacecraft’s construction. Gaia operated between 2013 and 2025, and scientists are still analyzing its data. ESA/M. Pedoussaut, 2013 Gaia observed almost 2 billion stars from different angles as the Earth moved from one side of the sun to the other during its yearly orbit. Studying the effects of parallax allowed researchers to determine the stars’ distances from Earth. Scientists then studied how the light from those stars dimmed and reddened as it traveled through the ISM on its way to Gaia. By collecting this data from a variety of angles, and by using the distance information they’d gathered through parallax, scientists were able to build up a better understanding of the density of the dust between stars. But turning that information into a 3D map of the ISM was not straightforward. Many possible configurations of the ISM could satisfy the same data, said Gregory Green, an astronomer at Westlake University in Hangzhou, China. More data offered the astronomers better constraints, but it also complicated their calculations. The challenge, Green said, is picking out the most physically plausible arrangement when the underlying math “becomes impossible.” Over the last decade, Green and other researchers built advanced statistical frameworks to tackle the calculation. In 2024, a separate team used these tools to create a continuous three-dimensional map of the density of the ISM’s dust inside a sphere more than 4,000 light-years wide around our sun. On this 3D map, unstable gas, depicted in yellow tones, wraps around more stable clumps of dust, depicted in blue. The small yellow dot in the center is our sun. The dust map showed researchers where interstellar dust was concentrated, revealing the dense clouds scattered through the space between stars. But it couldn’t tell them how hot or cold that dust was. To understand the full range of ISM temperatures, researchers would need a second map to reveal how it gets heated. That map would come from an unlikely source. State of Flux Jonathan Shelest, an undergraduate at the Technion in Haifa, Israel, remembers an astrophysics research seminar in 2024, when Shmuel Bialy, his professor, showed the students images of the gas and dust that gather into billowing structures such as the Pillars of Creation in the voids between stars. “I like to imagine the geometry of everything,” Shelest said. “It was only natural to start imagining all the dynamics, all the structure, all the beauty, and the richness.” Right after the lecture, Shelest emailed Bialy, asking to join his research group. In an act of kismet, Bialy had recently been looking for a student to explore the ISM through three-dimensional mapping, and so a research partnership was born. Shmuel Bialy, a professor at the Technion in Haifa, Israel, showed students images of the interstellar medium in class. Courtesy of Shmuel Bialy Shelest already had the map of the ISM’s dust. The plan was to combine that map with a map of the ultraviolet radiation that heats the ISM up. By chance, Bialy located just such a map by striking up a conversation at a conference with the astrophysicist Troy Porter of Stanford University, who had made a map but had yet to publish it. So Shelest, Bialy, and their colleagues set out to combine the 200 gigabytes of data in the two maps. At every point in space, they compared the density of the dust with the intensity of the radiation to understand where the ISM was hot and where it was cool. Eventually, they were able to combine the dust and radiation information on a three-dimensional grid. Shelest then set out to see what the map could tell him. The biggest surprise came when he investigated the ISM’s overall temperature: Shelest found that 27% of the ISM in our galactic neighborhood was cold, 32% was warm, and the remaining 41% sat squarely in the forbidden zone as unstable medium. “I thought I was wrong,” Shelest said. “How do you go to your science adviser and tell him that you get so much unstable media?” Jonathan Shelest, a student at the Technion, found the interstellar medium to be more unstable than expected. Sophia Leiderman But the map didn’t appear to be broken. Shelest saw no evidence of artifacts or random statistical noise in the 3D grid. Instead, the unstable ISM formed massive, coherent blankets that wrapped around the cold clouds completely. All that midrange medium, neither hot nor cold, implies that the older theory is incomplete, said Adam Ginsburg, an astronomer at the University of Florida. “Something is taking material that should, by the static theory, be sitting in one of these other two states, and it’s stirring it up so that it’s being forced to change states.” Desika Narayanan, an astrophysicist at the University of Florida, uses an organic metaphor. “Just like your blood in your body is going to have metabolic waste or oxygen in it, and it’s moving different things to different places,” he said, “the ISM is doing the same thing, but with energy, and it’s constantly in a state of flux.” A Measured Approach On the July day in 2026 that the group posted the paper, Shelest’s inbox filled with messages from excited astronomers and requests to collaborate. Still, researchers urge caution before we rewrite the textbooks. The model could have overestimated the amount of unstable ISM if cold and warm sections were too close together for the model to tell them apart, McKee said. Alternatively, the method the team used to calculate the overall distribution of gas and dust could have led them astray, said Philipp Frank, an astrophysicist at the Kavli Institute for Particle Astrophysics and Cosmology at Stanford. The researchers used an “ensemble-averaged mean,” a calculation that naturally tends to smooth over sharp contrasts. If a cold cloud transitioned abruptly to a warm one, this method would artificially soften its steep drop in density into a more gradual slope, which would inflate the amount of unstable ISM. Shelest and Bialy — whose analysis is currently undergoing peer review — acknowledge that limited resolution and map smoothing are both issues, but they argue that mathematical blurring alone cannot account for the majority of the unstable ISM. When the authors tested their modeling on an entirely different dust map with lower resolution, the unstable fraction shifted by only about 5%, they said. The Churn of Creation Galaxies are remarkably inefficient at taking raw material — gas and dust — and turning it into stars. For decades, simulations have struggled to explain why. The new map suggests an answer: Star formation is suppressed by the constant cycle of heating and cooling that churns the ISM. “The reason why star formation is very inefficient is that feedback heats up and pushes on the surrounding gas,” said Anna Rosen, an astrophysicist at San Diego State University. That churning could explain why classic models, which assume that the ISM is in a tranquil equilibrium, don’t quite seem to match reality. Rosen said the models give us “physically grounded snapshots” — unchanging images of patches of hot and cold ISM — “but in between those snapshots, there’s still a lot going on.” Next article How Do You Take a Picture of a Black Hole?
A New Map of ‘Empty’ Space Challenges a Tranquil Picture of the Galaxy
Full Article
Original Source
Read the full article at Quantamagazine →KhanList aggregates and links to publicly available news content. We do not host full articles from third-party sources. Always verify important information with original sources.